

- 写作 Write an essay based on the following chart. In your writing, you should 1) interpret the chart, 2) explain the phenomenon, and 3) give your comments. You should write about 150 words on the ANSWER SHEET 2.

扫码下载亿题库
精准题库快速提分
 参考答案
参考答案参考范文:
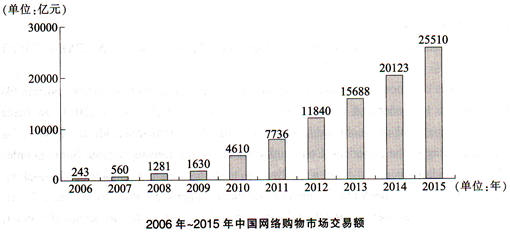
The bar chart given above reflects the sales changes of online shopping in domestic market over the period from 2006 to 2015. The turnover of e-shopping saw a substantial gain from 24.3 billion in 2006 to 2012.3 billion in 2014. Surprisingly, it is predicted that the figure will continue to soar dramatically to 2551 billion in 2015.
At least two fundamental factors could contribute to this phenomenon. Firstly, it is convenient for consumers to buy goods over the Internet, for online stores are usually available 24 hours a day, and many consumers have Internet access both at work and at home. Secondly, commodity information is available to consumers. Online retailers will describe products with text, photos, and supplemental information, such as instructions and safety procedures. Some provide advice and help consumers decide which product to buy.
Consumers have benefited a lot from e-commerce, but online trading is by no means without its limitations. Hence, we should pay attention to fraud and security concerns. Only in this way can we maximize the merits and minimize the demerits of online purchasing.
 您可能感兴趣的试题
- 1 【写作】Write an essay based on the following graphs. In your essay, you should 1)interpret the graphs, and 2)give your comments. You should write about 150 words. Write your essay on the ANSWER SHEET.
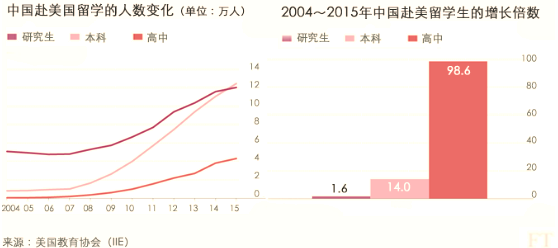 备注:美国教育协会 IIE-institute of international education
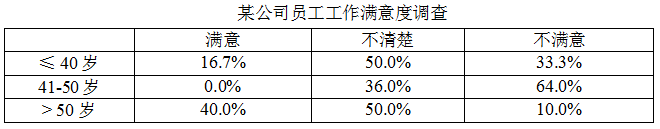
- 2 【写作】Write an essay based on the following table. In your writing, you should 1) Describe the table, and 2) Give your comments You should write at least 150 words. Write your essay on the ANSWER SHEET.
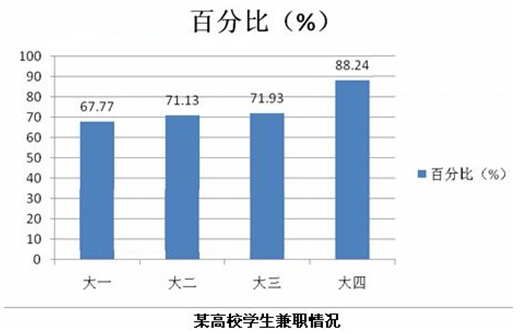
- 3 【写作】Write an essay based on the following chart in your writing, you should 1) interpret the chart, and 2) give your comments You should write about 150 words on the ANSWER SHEET.
- 4 【写作】Write an essay based on the following chart. In your writing, you should 1) interpret the chart, and 2) give your comments. You should write about 150 words on the ANSWER SHEET.
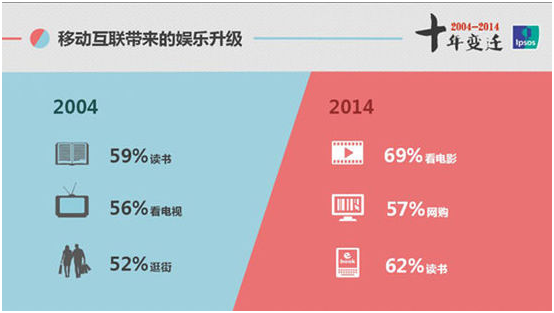
- 5 【写作】Write an essay based on the following graph explaining the upgrading of mass entertainment transformation brought about by the increasing mobile internet access. In your essay, you should 1) interpret the graph, and 2) give your comments. You should write about 150 words. Write your essay on the ANSWER SHEET.
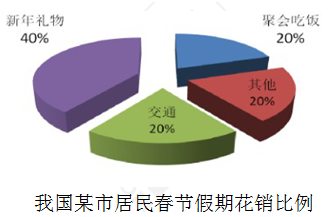
- 6 【写作】Write an essay based on the following chart. In your writing, you should 1)interpret the chart, and 2)give your comments. You should write about 150words on the ANSWER SHEET.

- 7 【写作】Write an essay based on the following chart. You should 1) interpret the chart, and 2) give your comments. You should write about 150 words on the ANSWER SHEET.
- 8 【写作】Write an essay based on the following chart.In your writing, you should 1)interpret the chart,and 2)Give your comments. You should write about 150 words on the ANSWER SHEET.

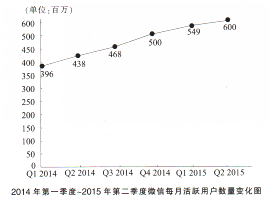
- 9 【写作】Write an essay based on the following chart. In your essay, you should 1) interpret the chart, and 2) give your comments. You should write at least 150 words. Write your essay on the ANSWER SHEET. 2014年第一季度~2015年第二季度微信每月活跃用户数量变化图
- 10 【写作】 Write an essay based on the following charts to 1) interpret the charts, 2) explain the phenomenon, and 3) give your comments. You should write about 150 words on the ANSWER SHEET.

- (14)
- 北方人不都爱吃面食,但南方人都不爱吃面食。 如果已知上述第一个断定真,第二个断定假,则以下哪项据此不能确定真假()。 Ⅰ.北方人都爱吃面食,有的南方人也爱吃面食; Ⅱ.有的北方人爱吃面食,有的南方人不爱吃面食; Ⅲ.北方人都不爱吃面食,南方人都爱吃面食。
- 某些精神失常患者可以通过心理疗法而痊愈,例如,癔症和心因性反应等。然而,某些精神失常是因为大脑神经递质化学物质不平衡,例如精神分裂症和重症抑郁,这类患者只能通过药物进行治疗。 上述论述是基于以下哪项假设()。
- 。() (1) (2)
- (5)
- (7)
- (20)
- 火车提速利大于弊近年来,火车提速一直是一个热门话题。对此,有些人持肯定态度,认为火车提速能带来很多便利。但也有些人持否定态度,他们认为火车提速带来的弊要多于利。请谈谈你的看法。
亿题库—让考试变得更简单
已有600万用户下载
9OD07