-

下载亿题库APP
-
联系电话:400-660-1360
下载亿题库APP
联系电话:400-660-1360

请谨慎保管和记忆你的密码,以免泄露和丢失
请谨慎保管和记忆你的密码,以免泄露和丢失

扫码下载亿题库
精准题库快速提分
 参考答案
参考答案
参考范文:
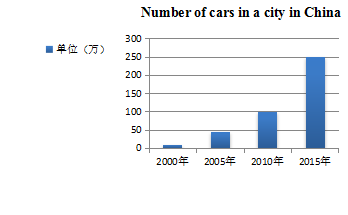
Recent years have witnessed the dramatic changes in the number of cars in a big city in China. From the chart we can clearly see a steady trend of increase. In 2000 and 2005, there were only 100 thousand and 450 thousand cars respectively, but in the past few years, the figure has jumped from 1 million in 2010 to 2.5 million in 2015.
With the improvement of living standard, more and more people can fulfill their dreams of owning a car and the constant drops of prices help to fuel this boom. But some people consider this a mixed blessing in that the increasing number of cars results in such negative effects as serious traffic jams and air pollution.
What shall we do to cope with the problem? I think it can be approached from several directions. First of all, we must develop more buses or subways to ease the traffic difficulty during the rush hours. At the same time, effective measures should be taken to reduce harmful gases. Only in this way can we avoid the negative effects while keeping the convenience that car industry has brought to us.
 您可能感兴趣的试题
亿题库—让考试变得更简单
已有600万用户下载
yWPO9