-

下载亿题库APP
-
联系电话:400-660-1360
下载亿题库APP
联系电话:400-660-1360

请谨慎保管和记忆你的密码,以免泄露和丢失
请谨慎保管和记忆你的密码,以免泄露和丢失
Confidence Intervals for the Population Mean
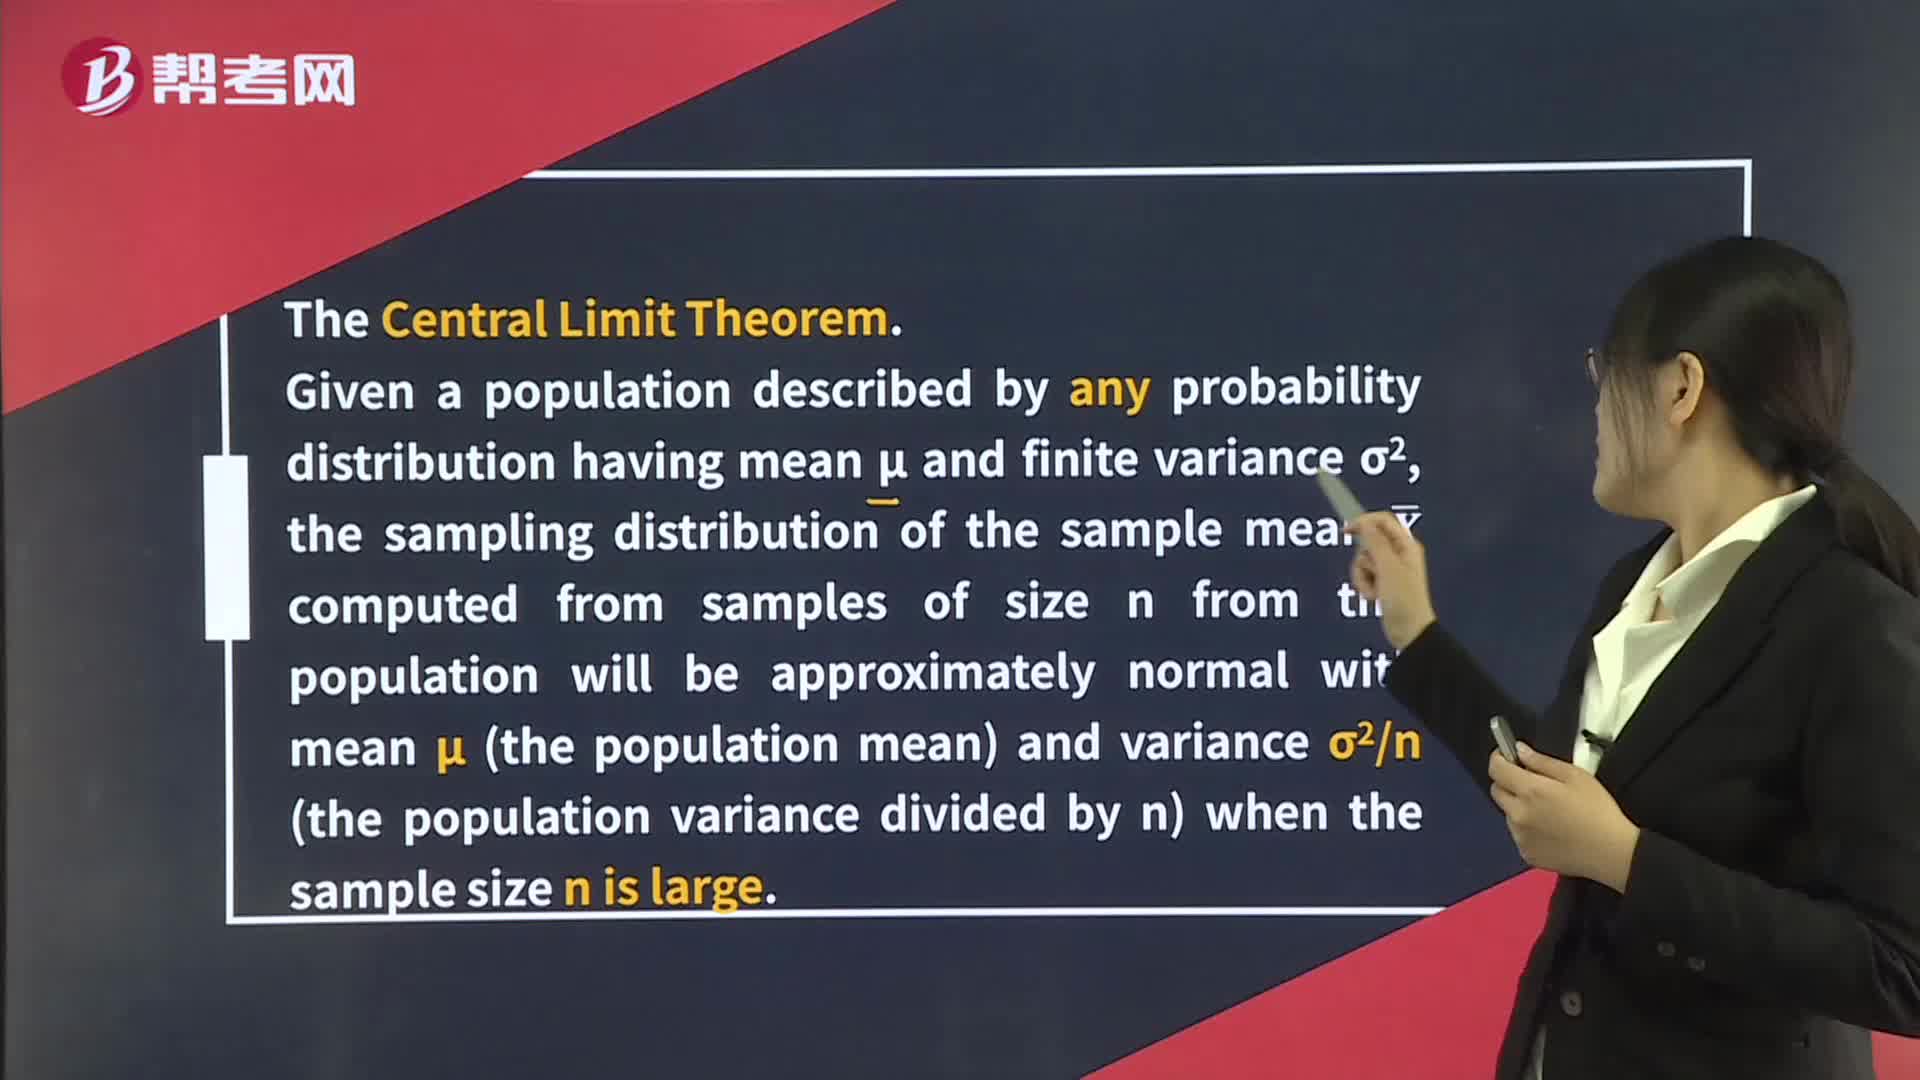
Distribution of the Sample Mean
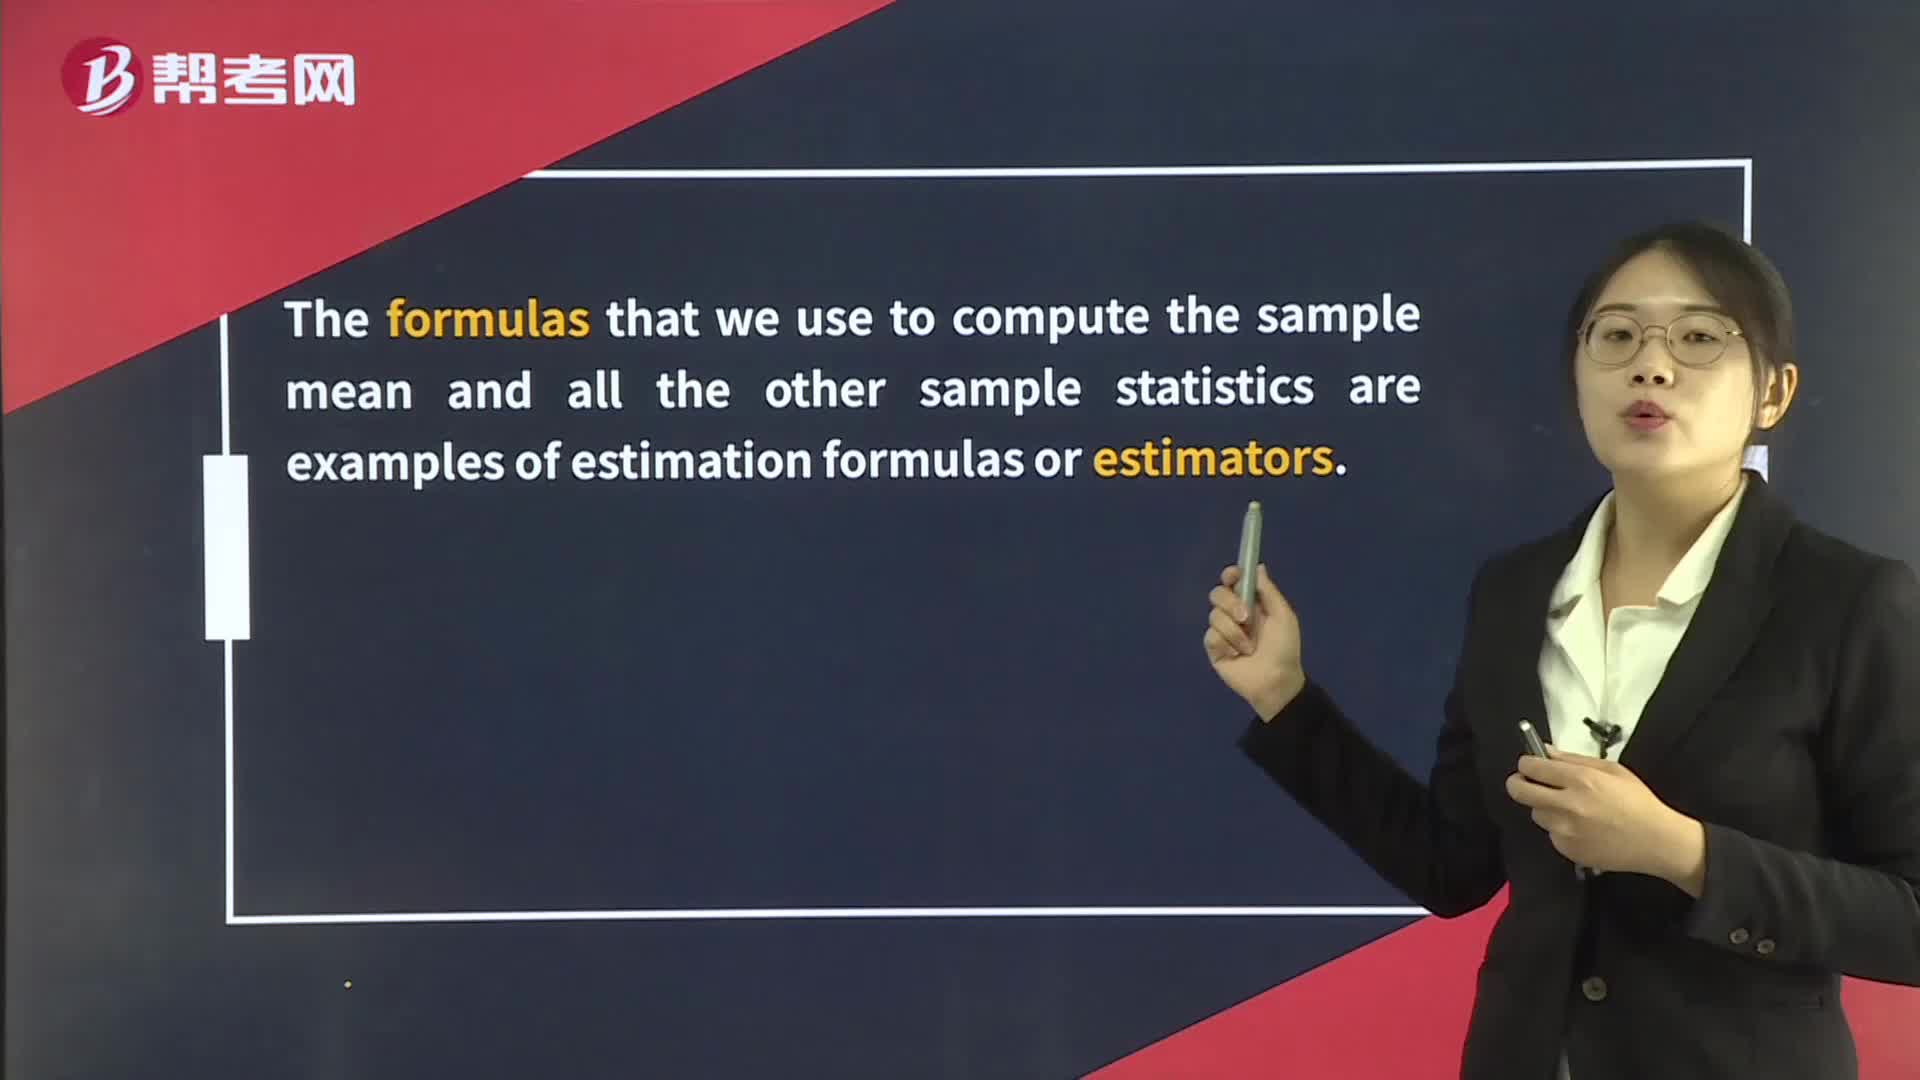
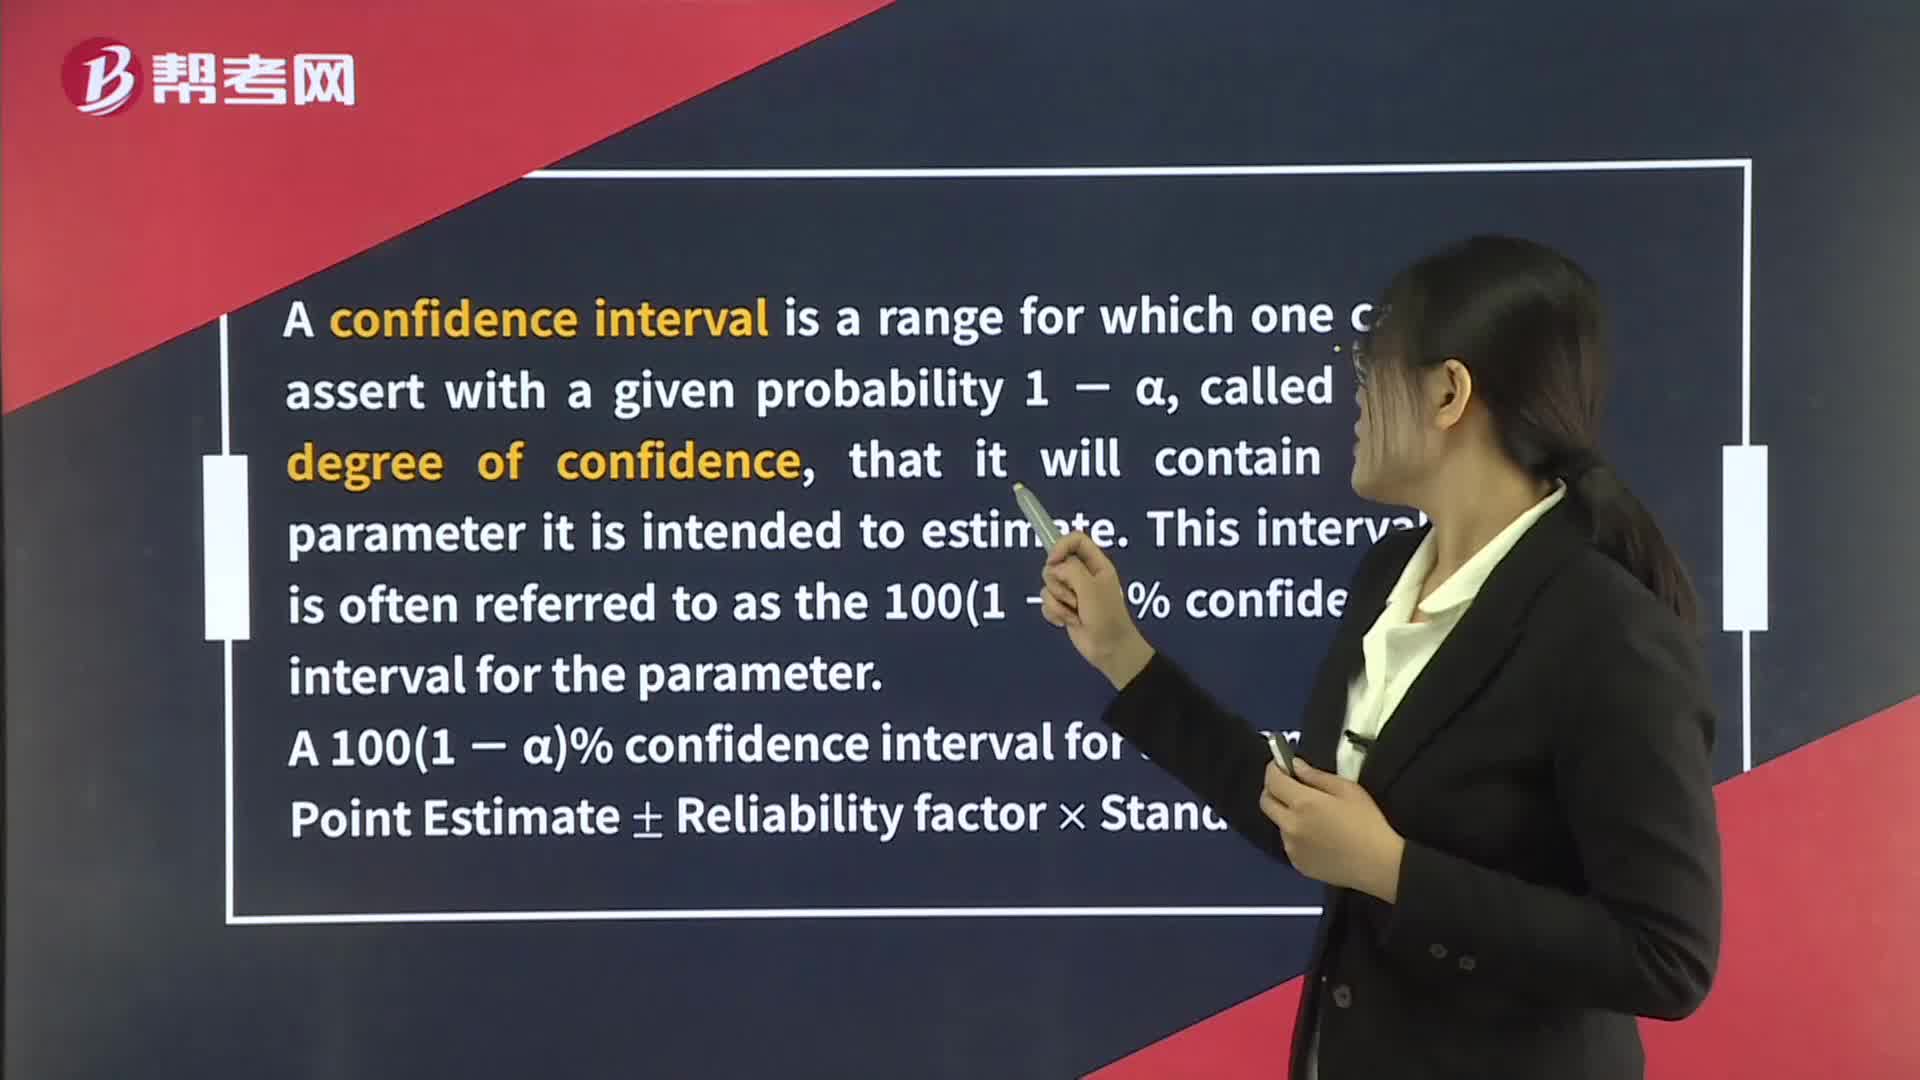
Point and Interval Estimates of the Population Mean
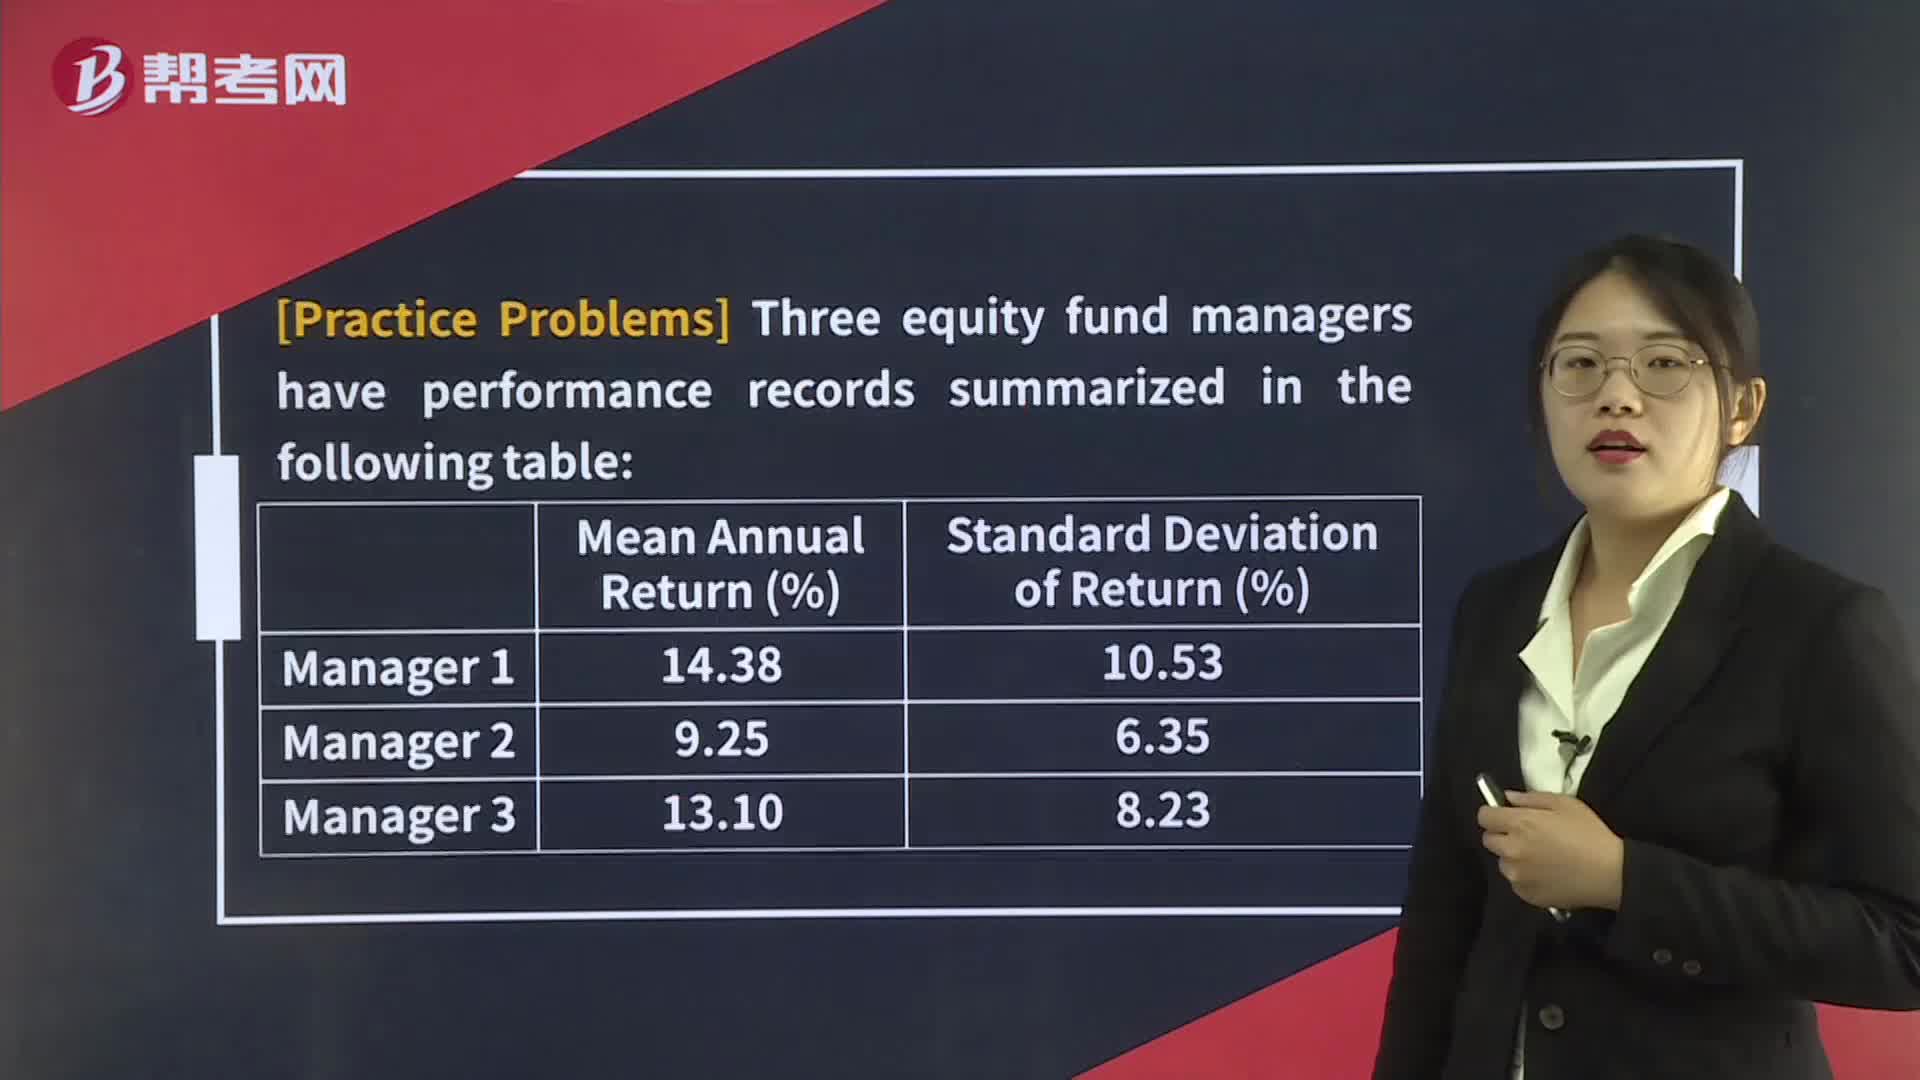
The Sharpe Ratio
Hypothesis Tests Concerning the Mean
Distribution of the Sample Mean
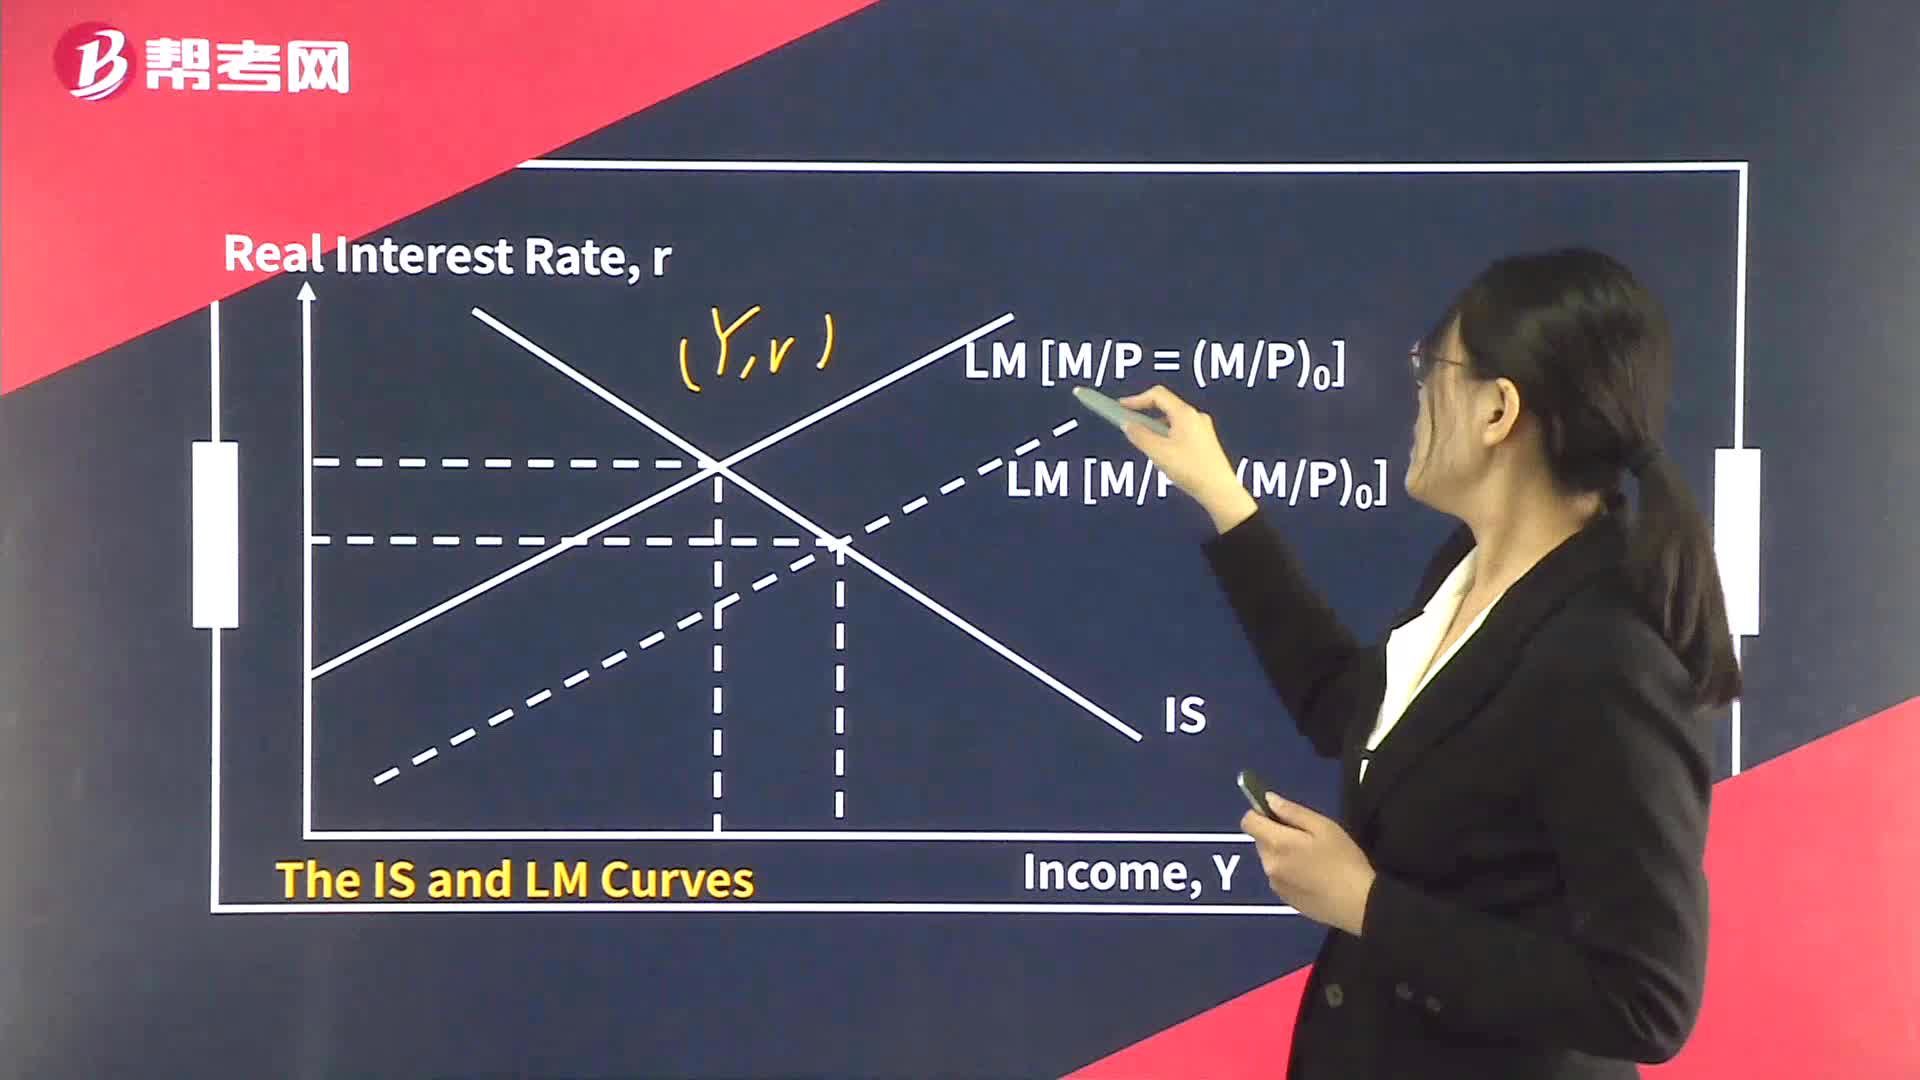
The IS Curve
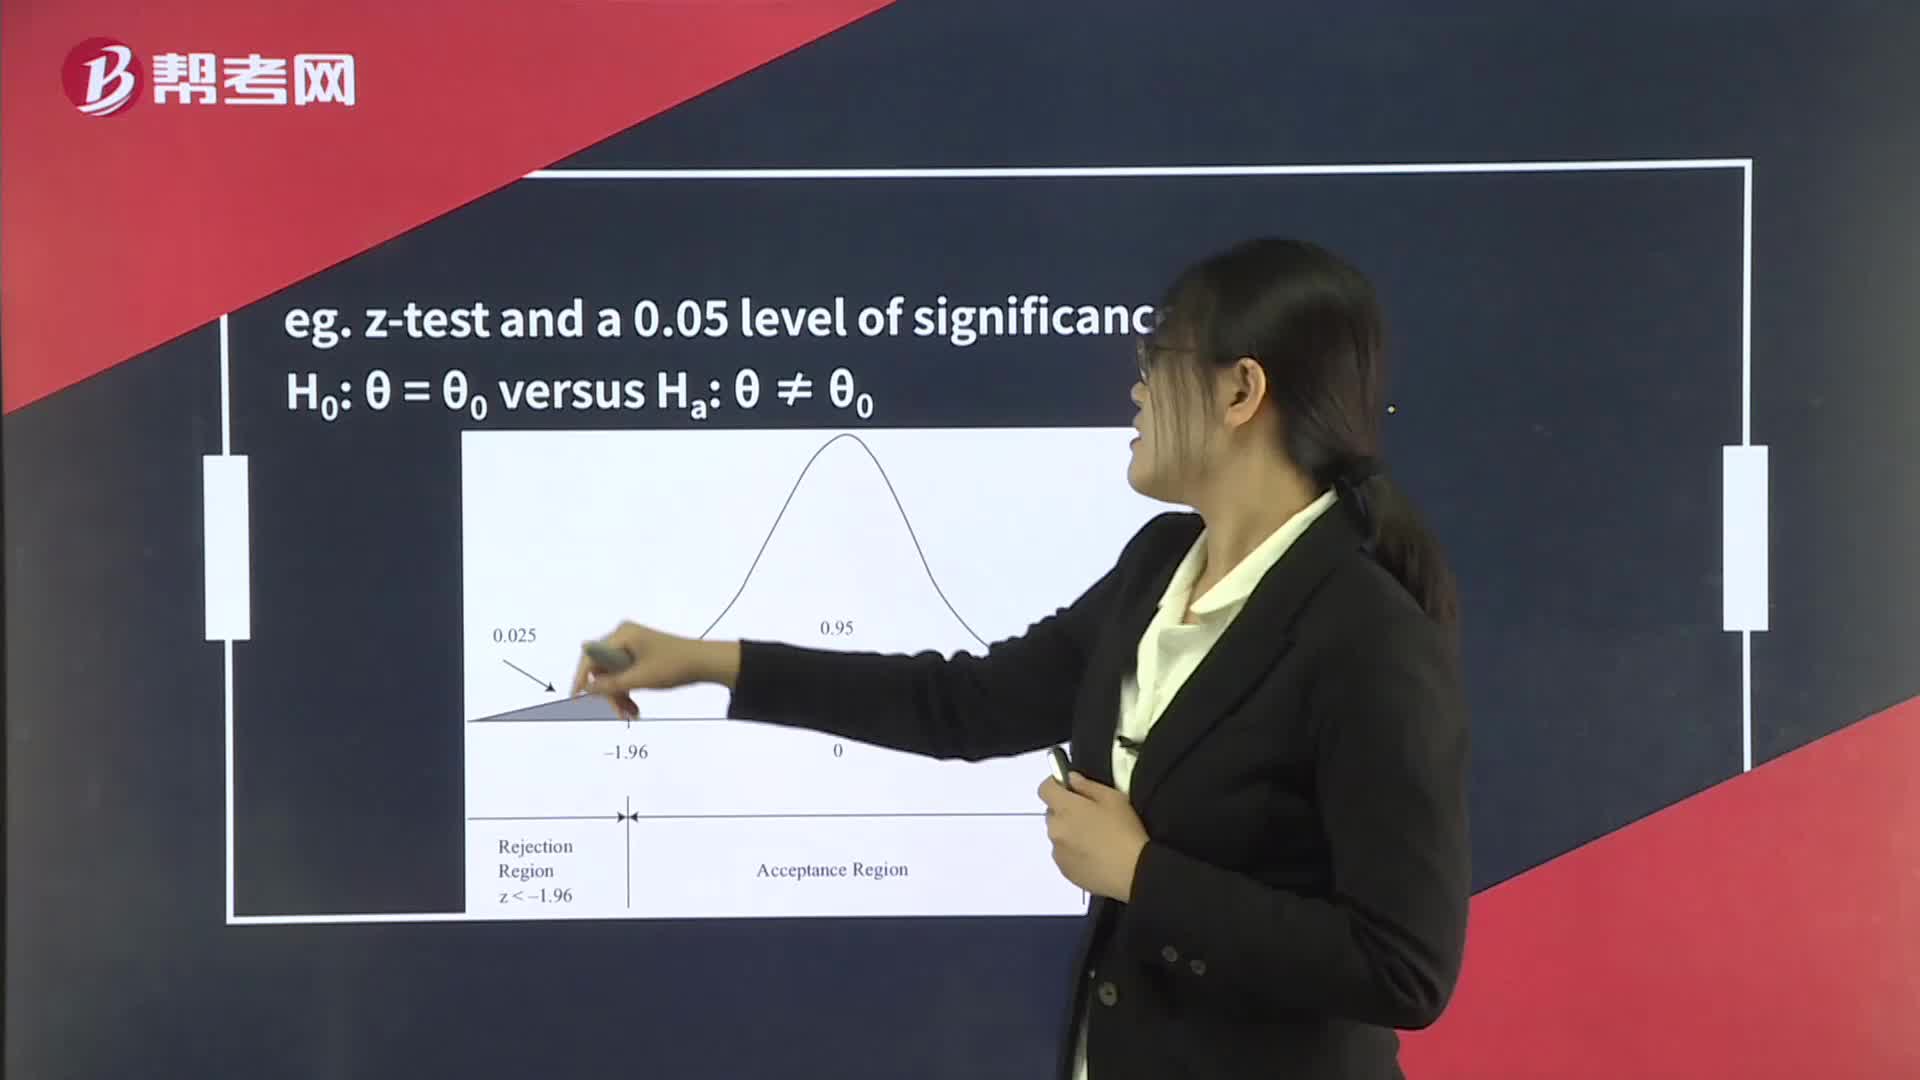
Rejection Point (Critical Value) for the Test Statistic
The Aggregate Demand Curve
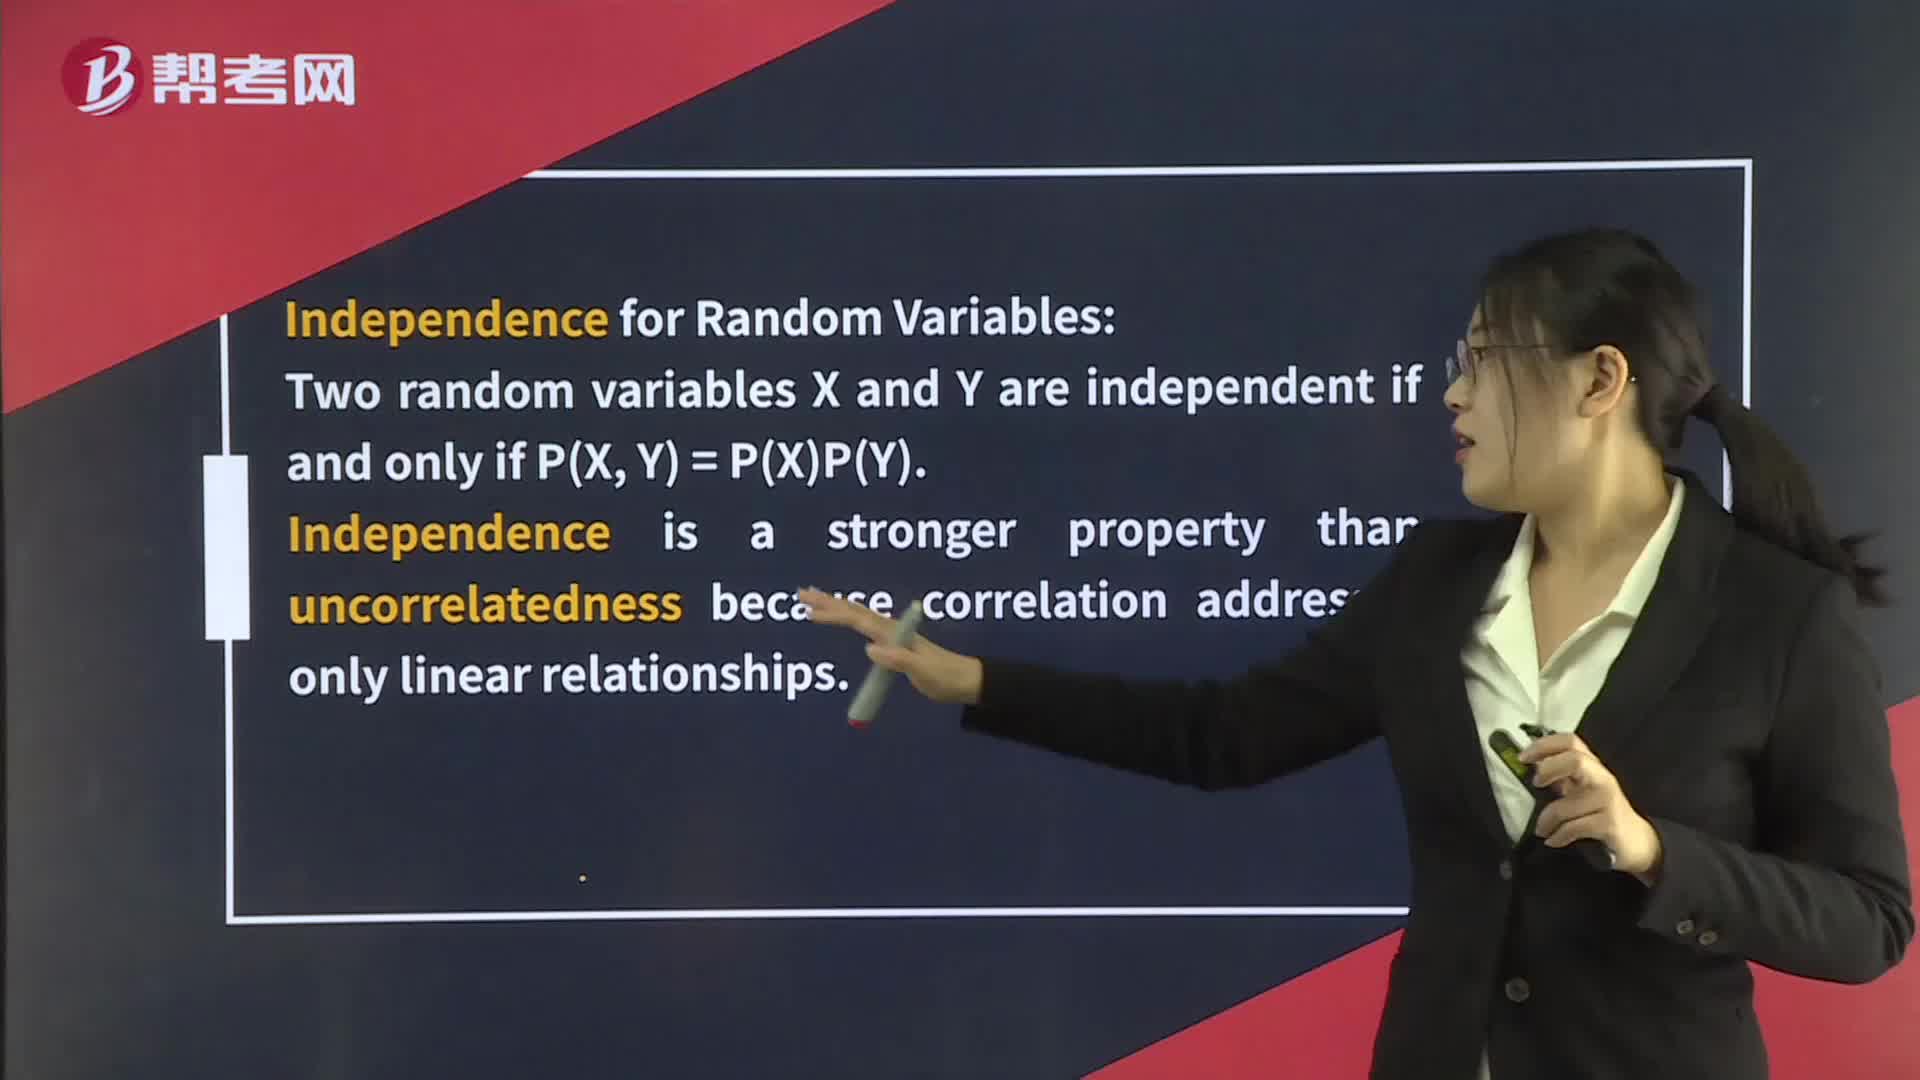
Multiplication Rule For Expected Value
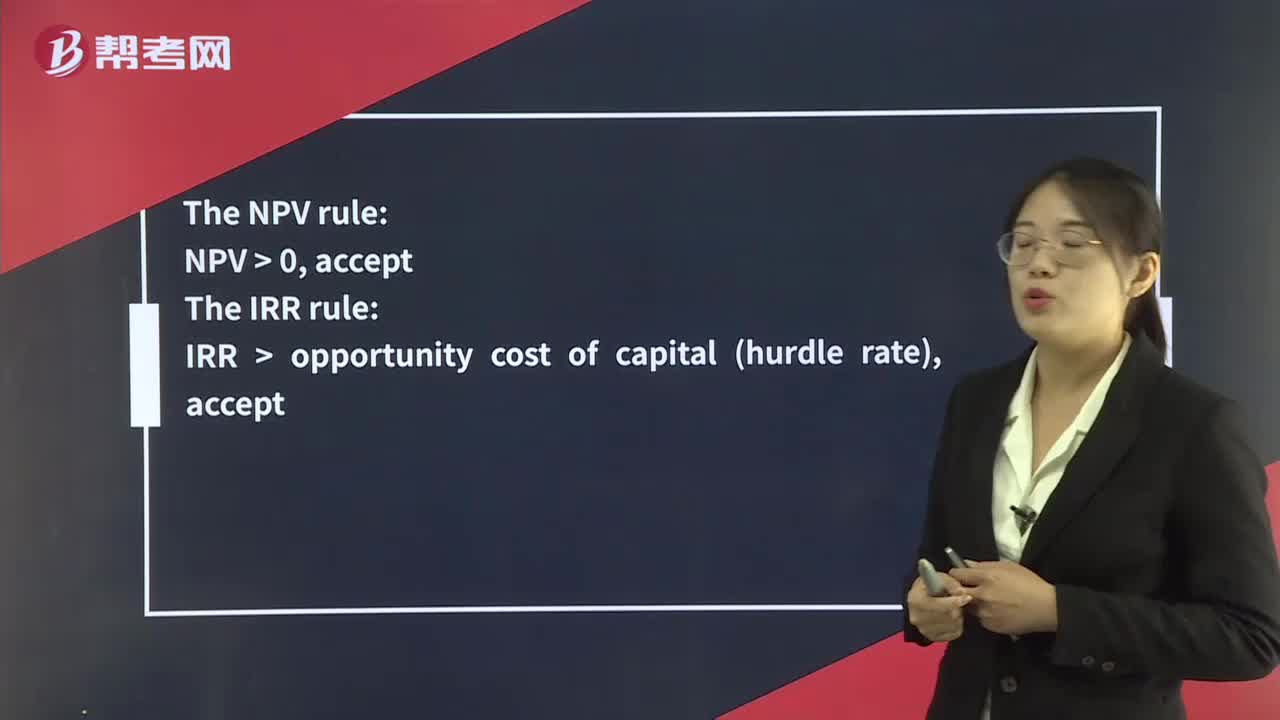
The NPV Rule & The IRR Rule
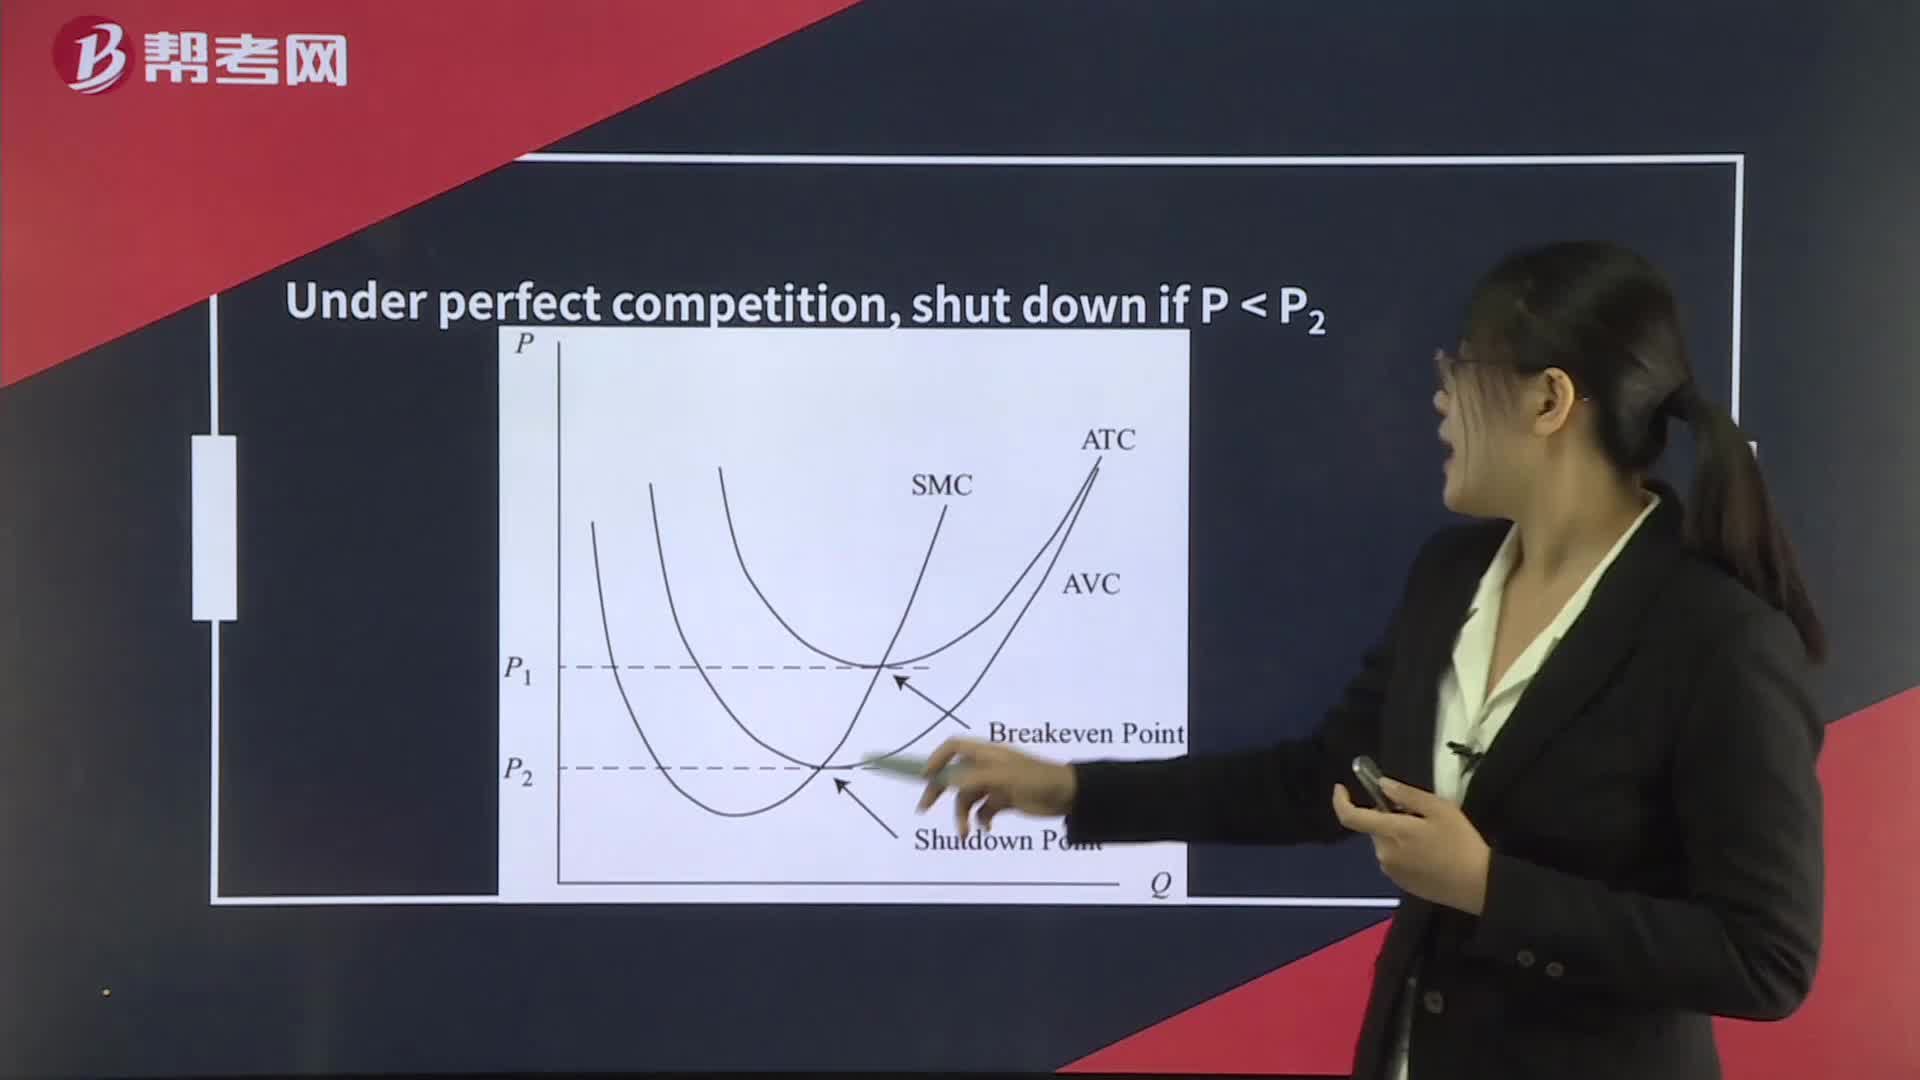
The Shutdown Decision
 02:32
02:32
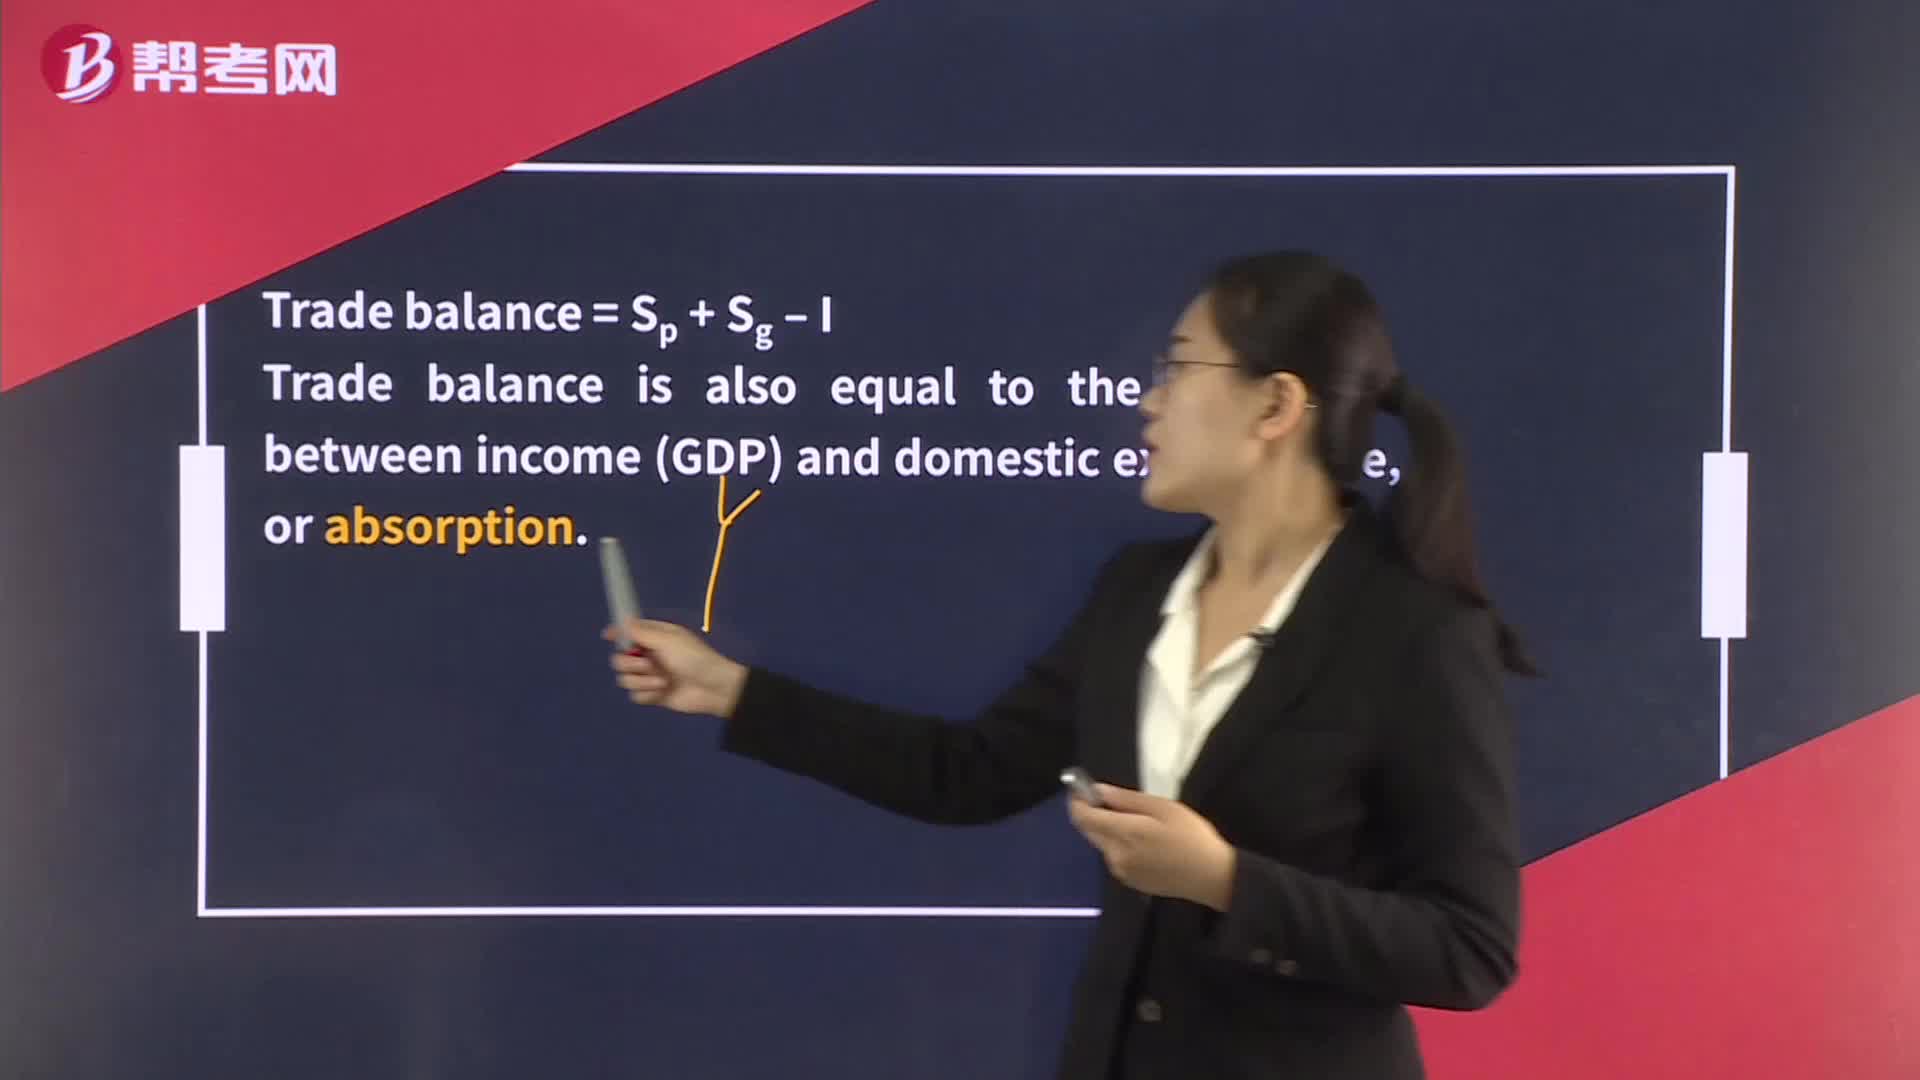
The AbsorptionApproach:or absorption.:surpluscapital.balanceaccount.
 21:36
21:36
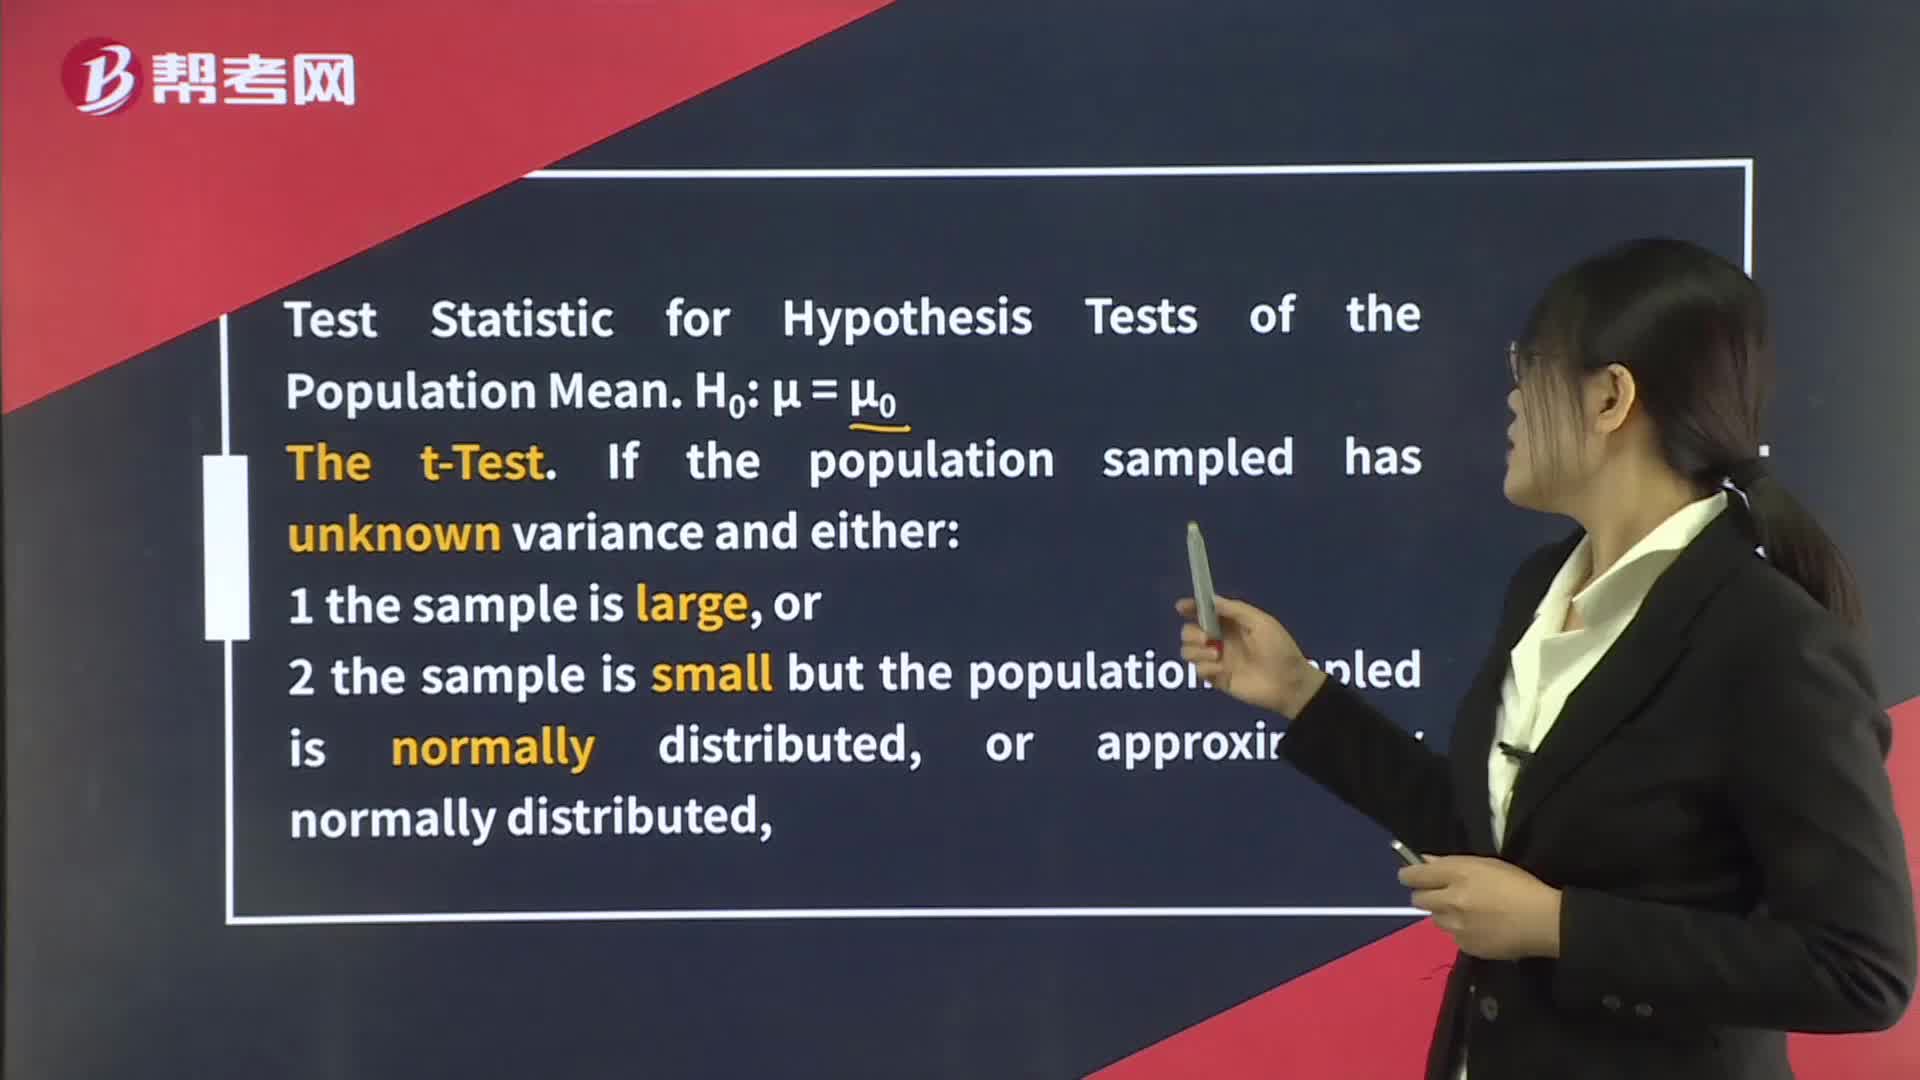
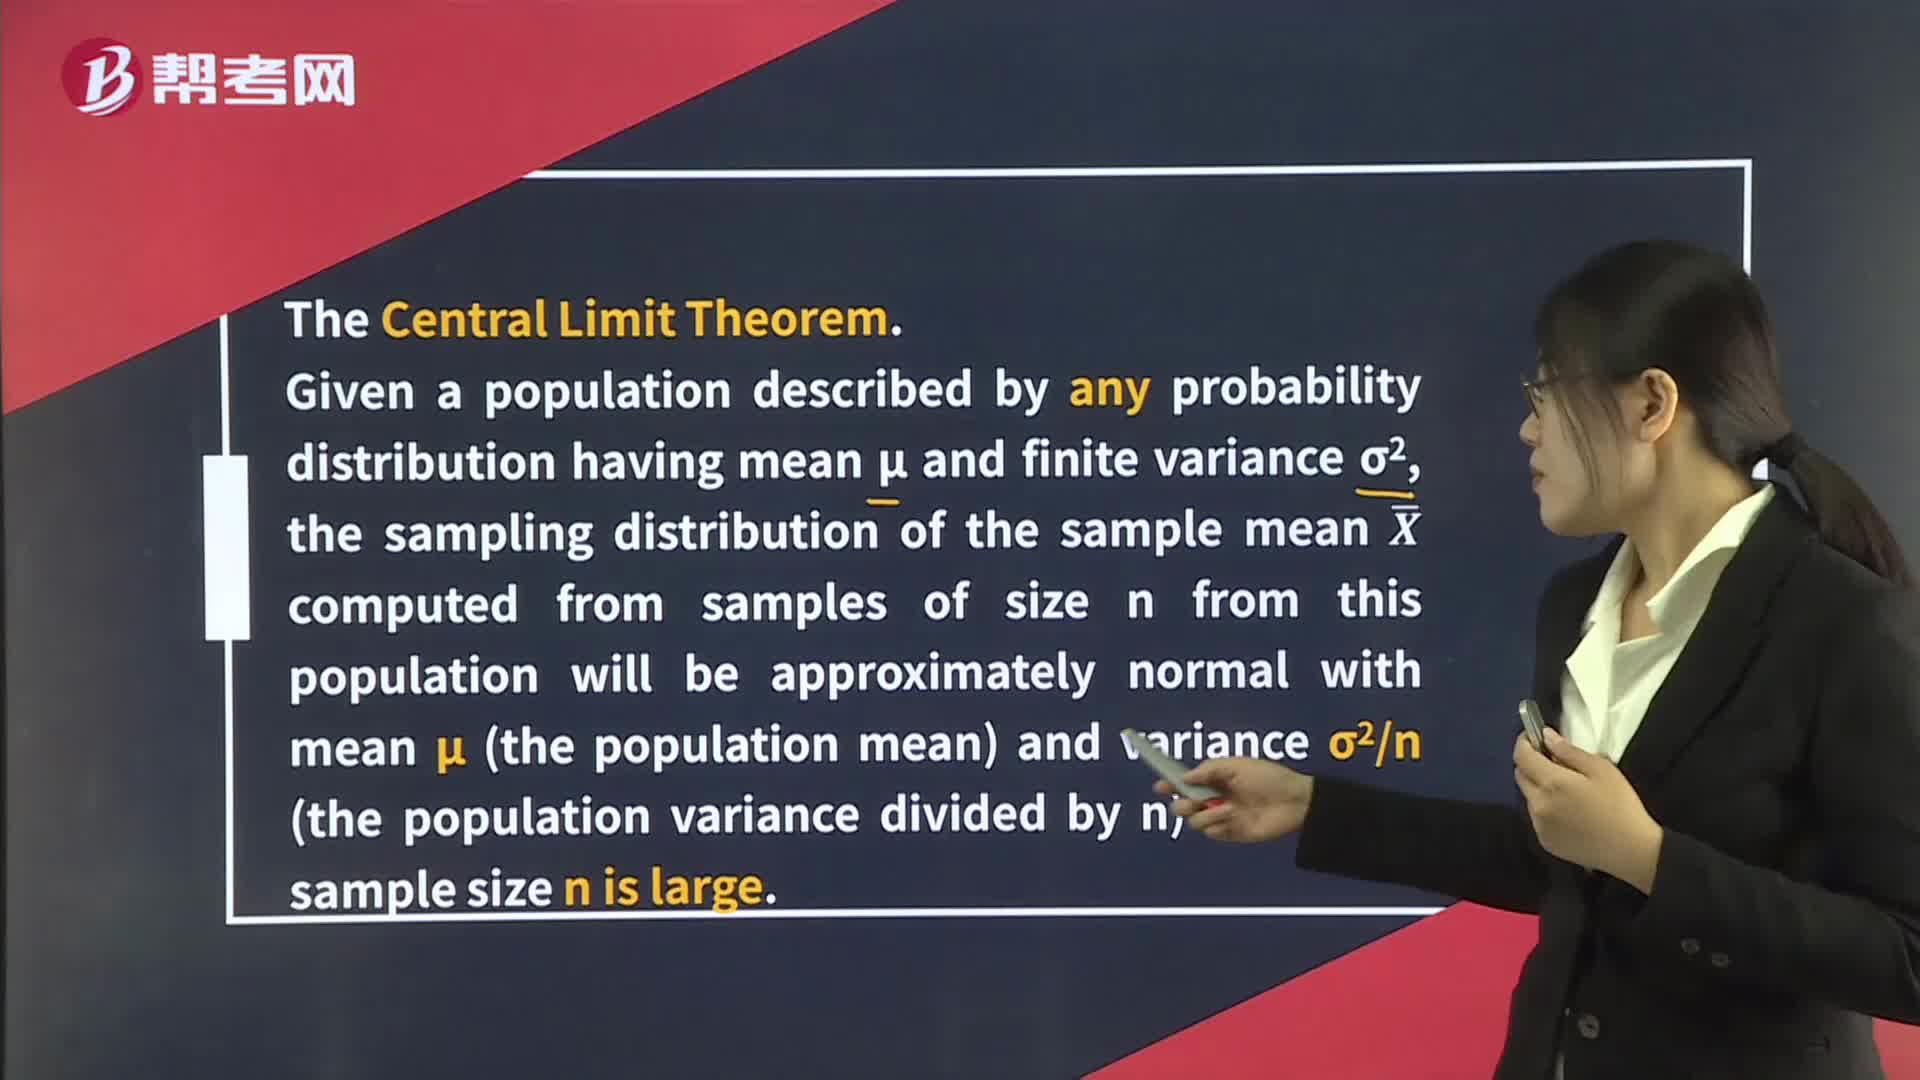
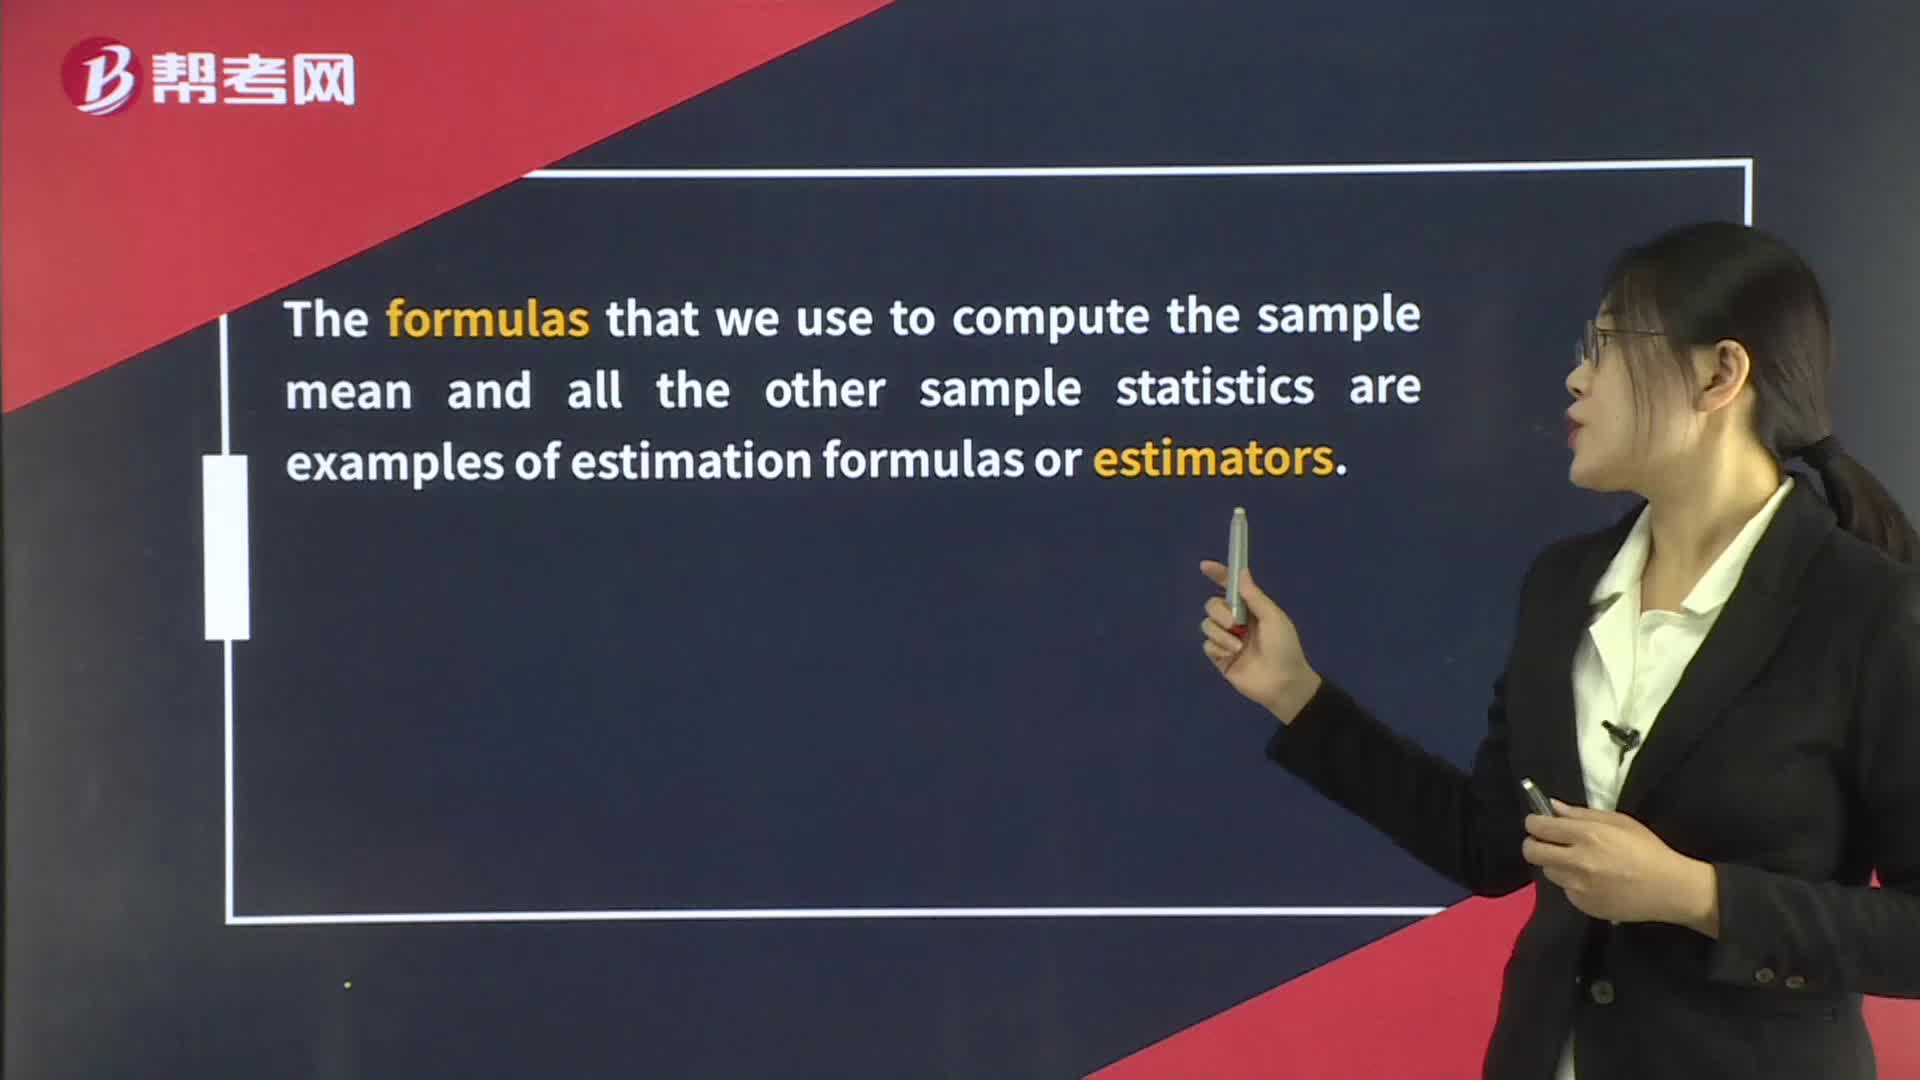
Point and Interval Estimates of the Population Mean:value that we calculate from sample observations using an estimator is:distribution.,meanEfficiency.[Practiceerror
 10:46
10:46
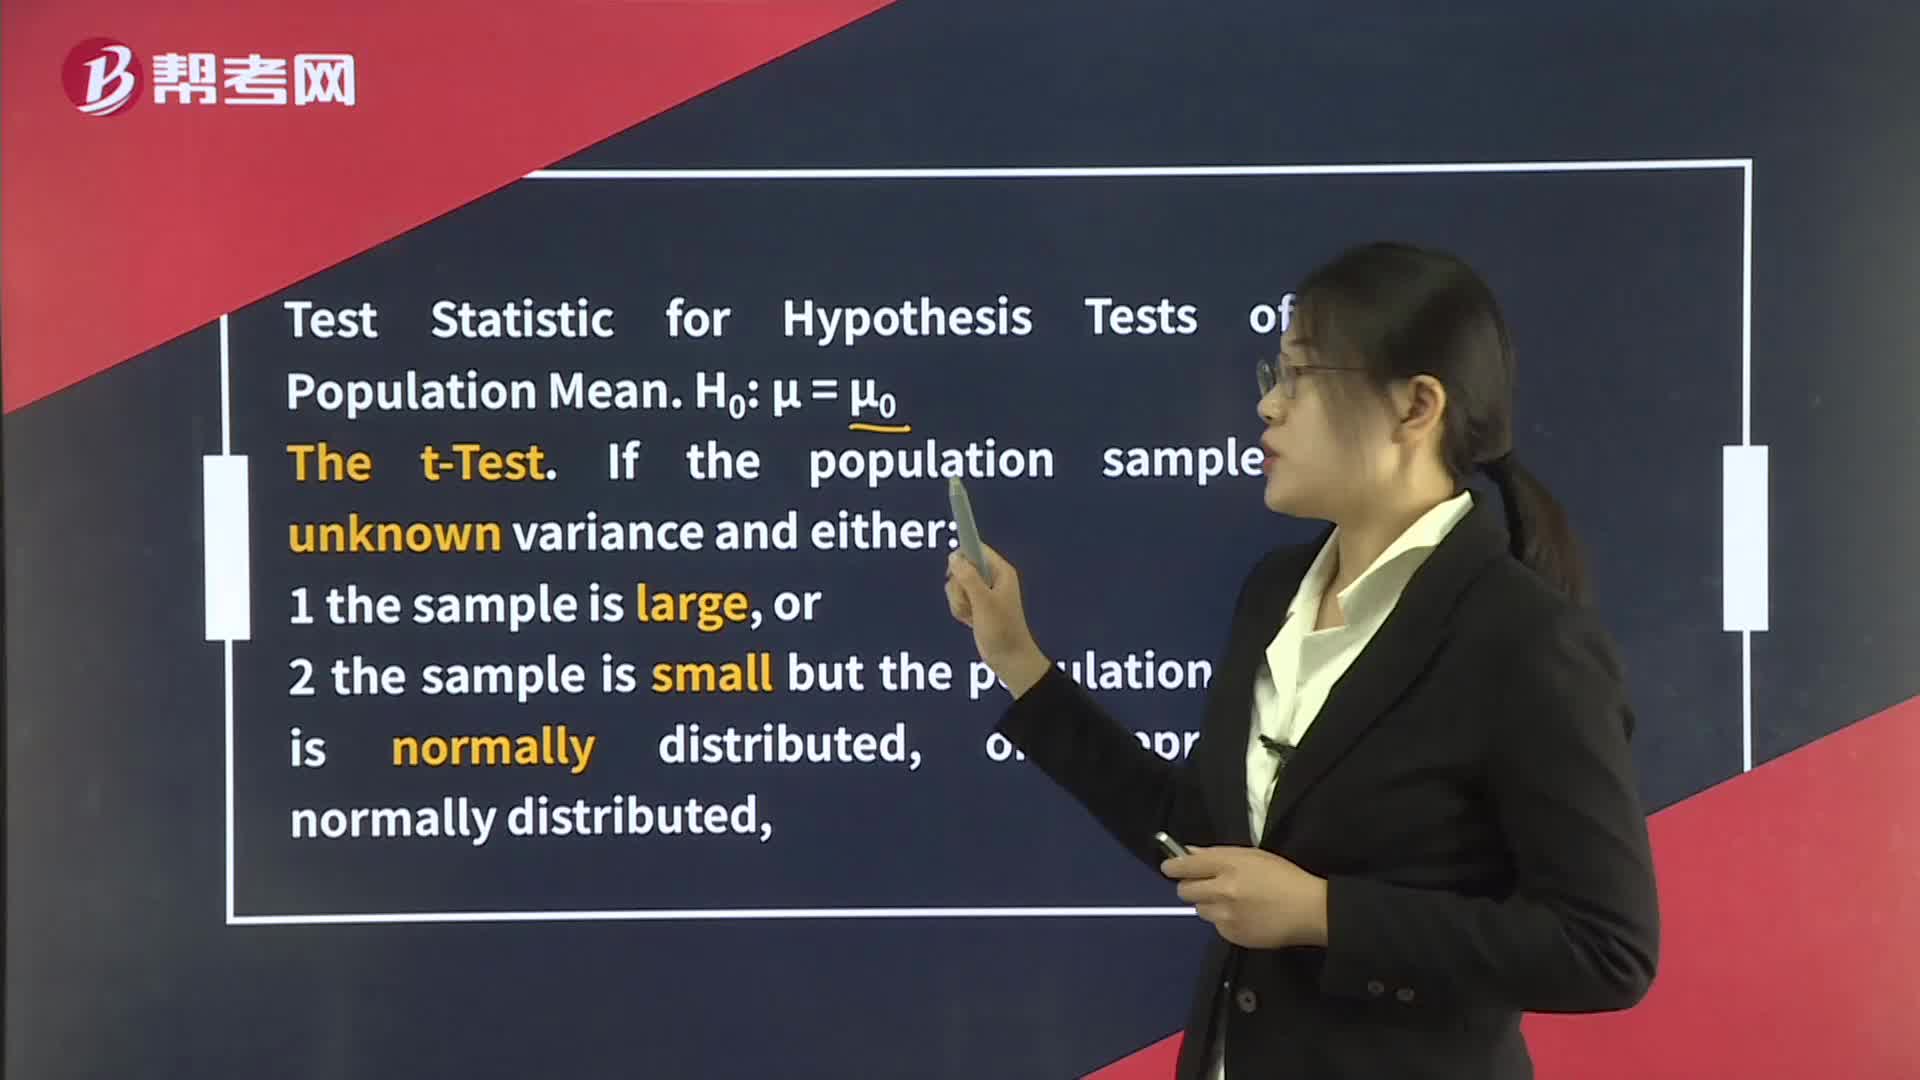
Hypothesis Tests Concerning the Mean:μ,The:Independent samples:[PracticeB.C.the consultant’s
 02:09
02:09
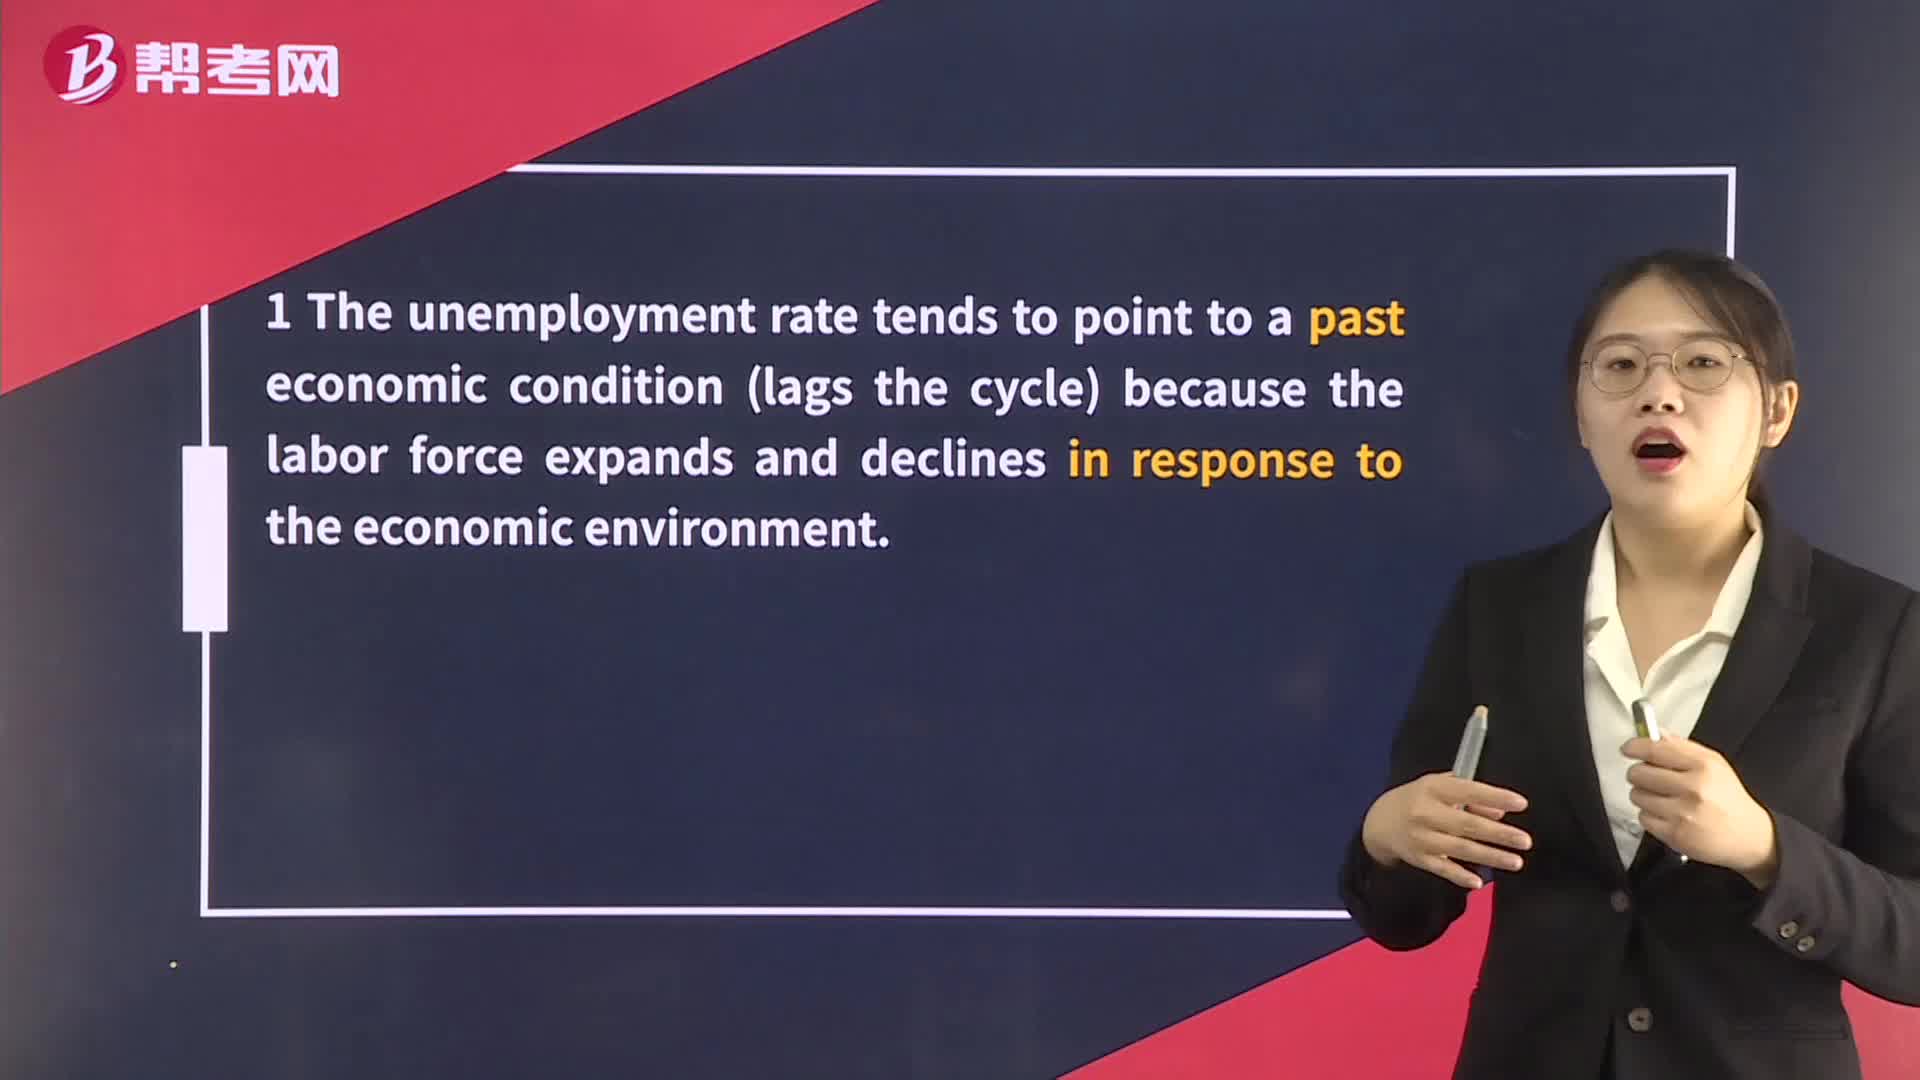
The Unemployment Rate:The Unemployment Rate:environment.measure the labor force in terms of the working-age population.constraints written into labor contracts that make layoffs expensive.
 03:15
03:15
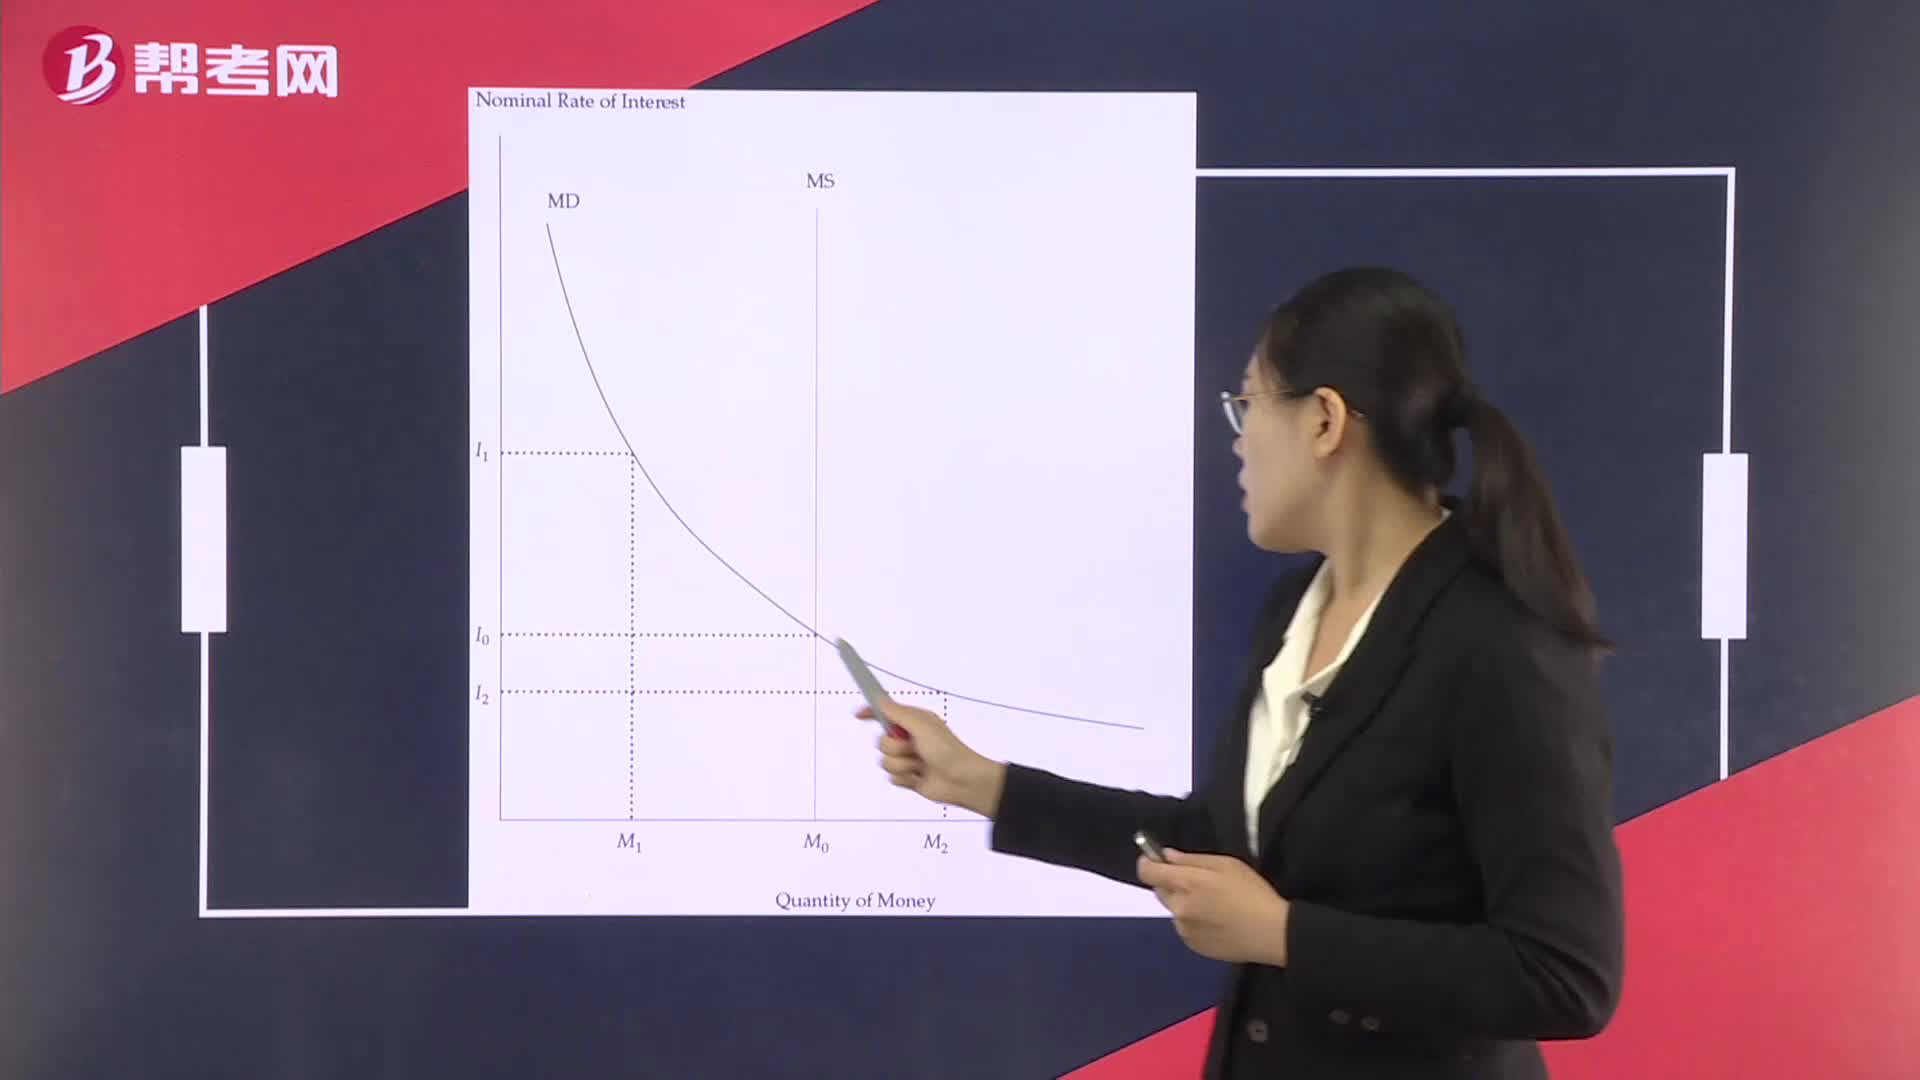
The Supply and Demand for Money:Interest”rates effectively adjust to bring the market into:Moneythat the money supply can affect real things in the short run.
 02:16
02:16
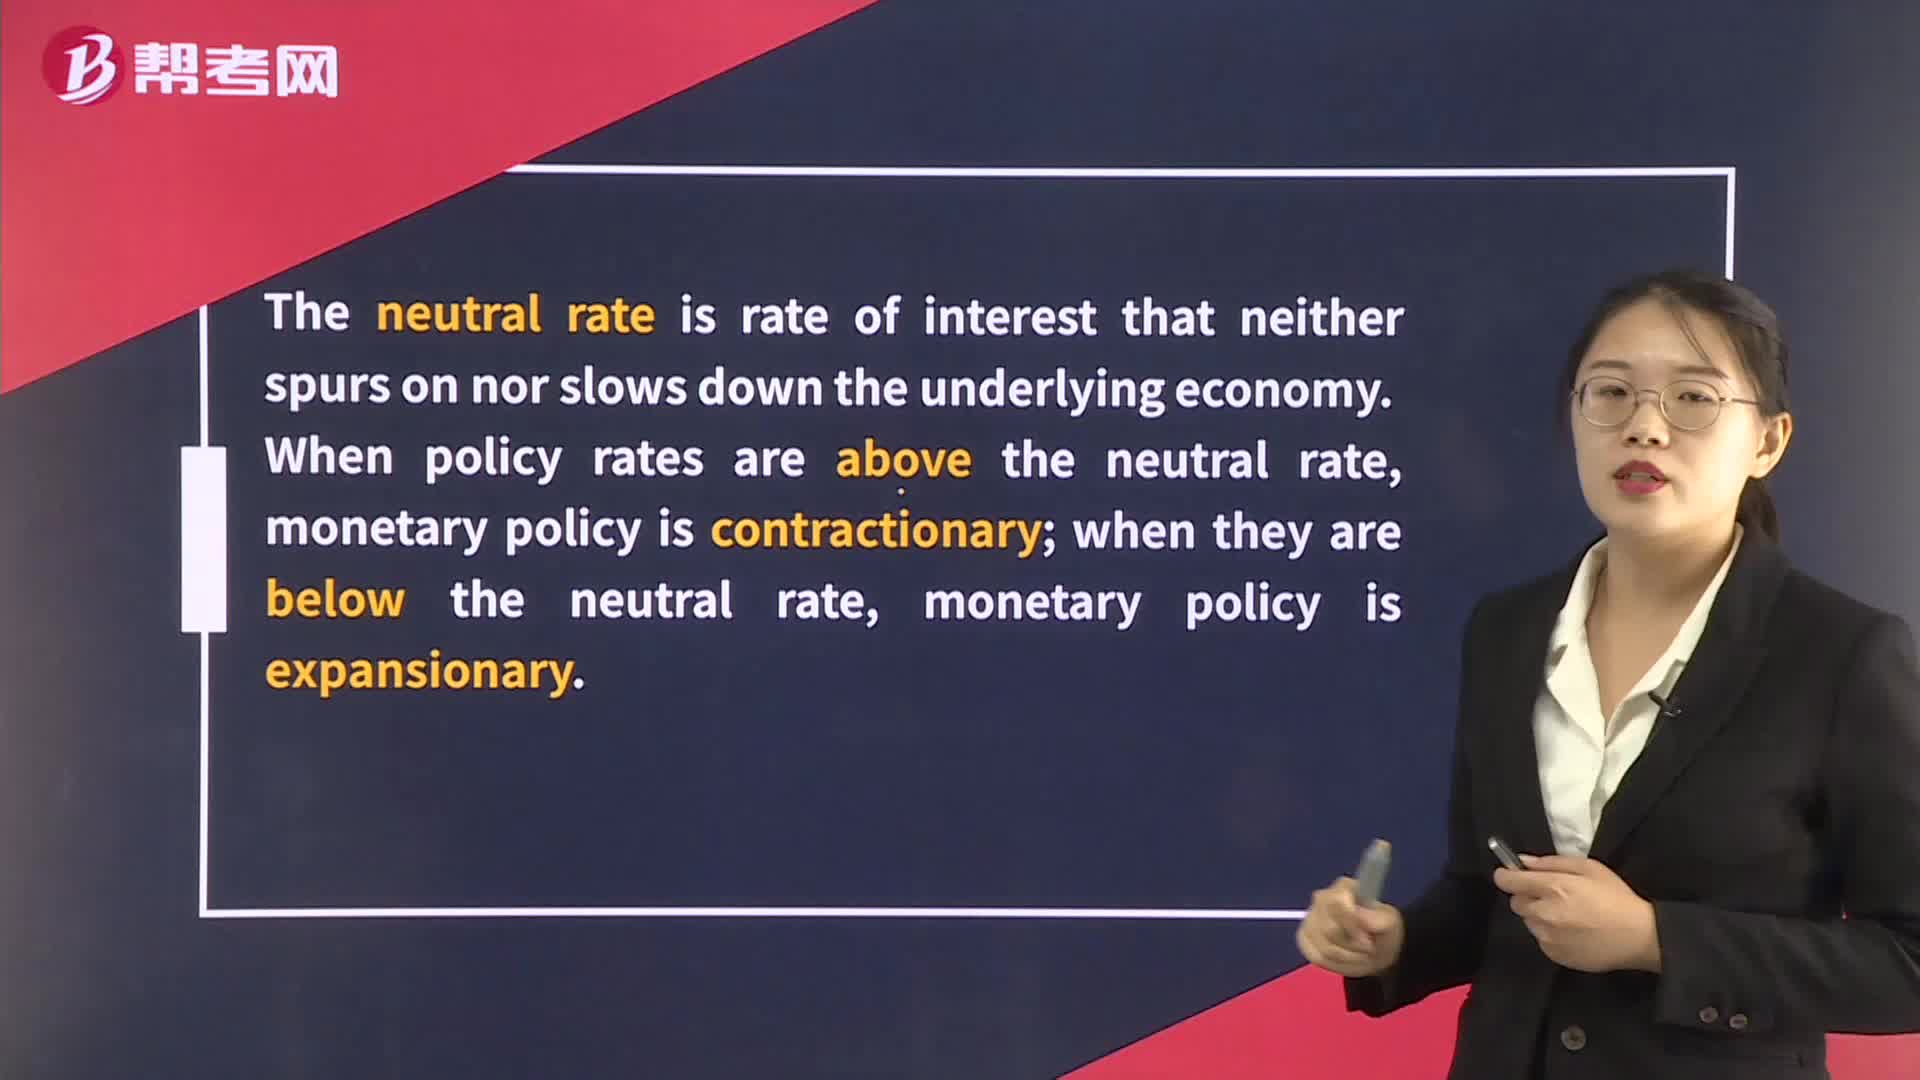
The Neutral Rate:The neutral;underlying economy.:economyLong-runrates might make a bad situation worse.
 03:05
03:05
The Money Creation Process:1 divided by the reserve requirement is the money multiplier.
 01:30
01:30
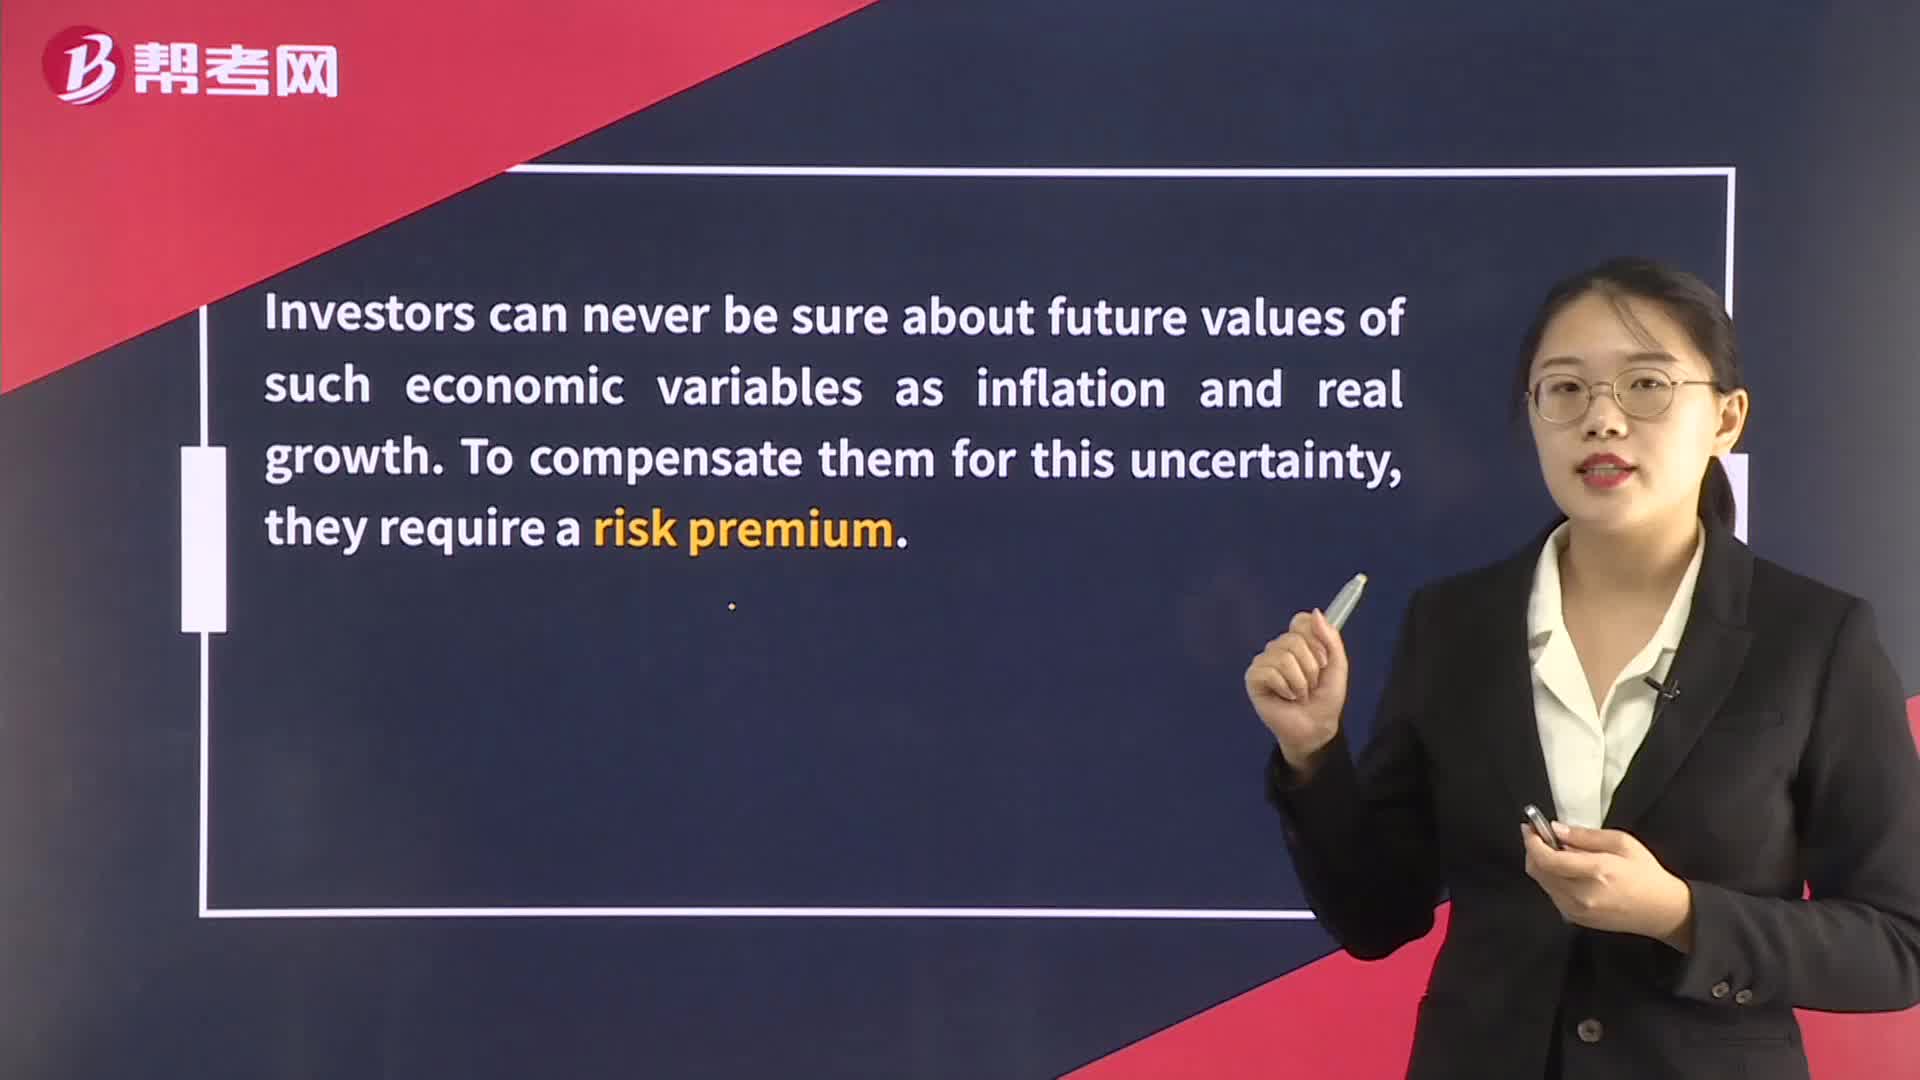
The Fisher Effect:The Fisher:interest in an economy is stable over time so that changes in nominal interest rates are the result;premium.premium to compensate them for uncertainty.
 02:18
02:18
The Demand for Money:time.balances will tend to be inversely related to the expected return on other financial assets and directly related to the perceived risk of other financial assets.
 04:31
04:31
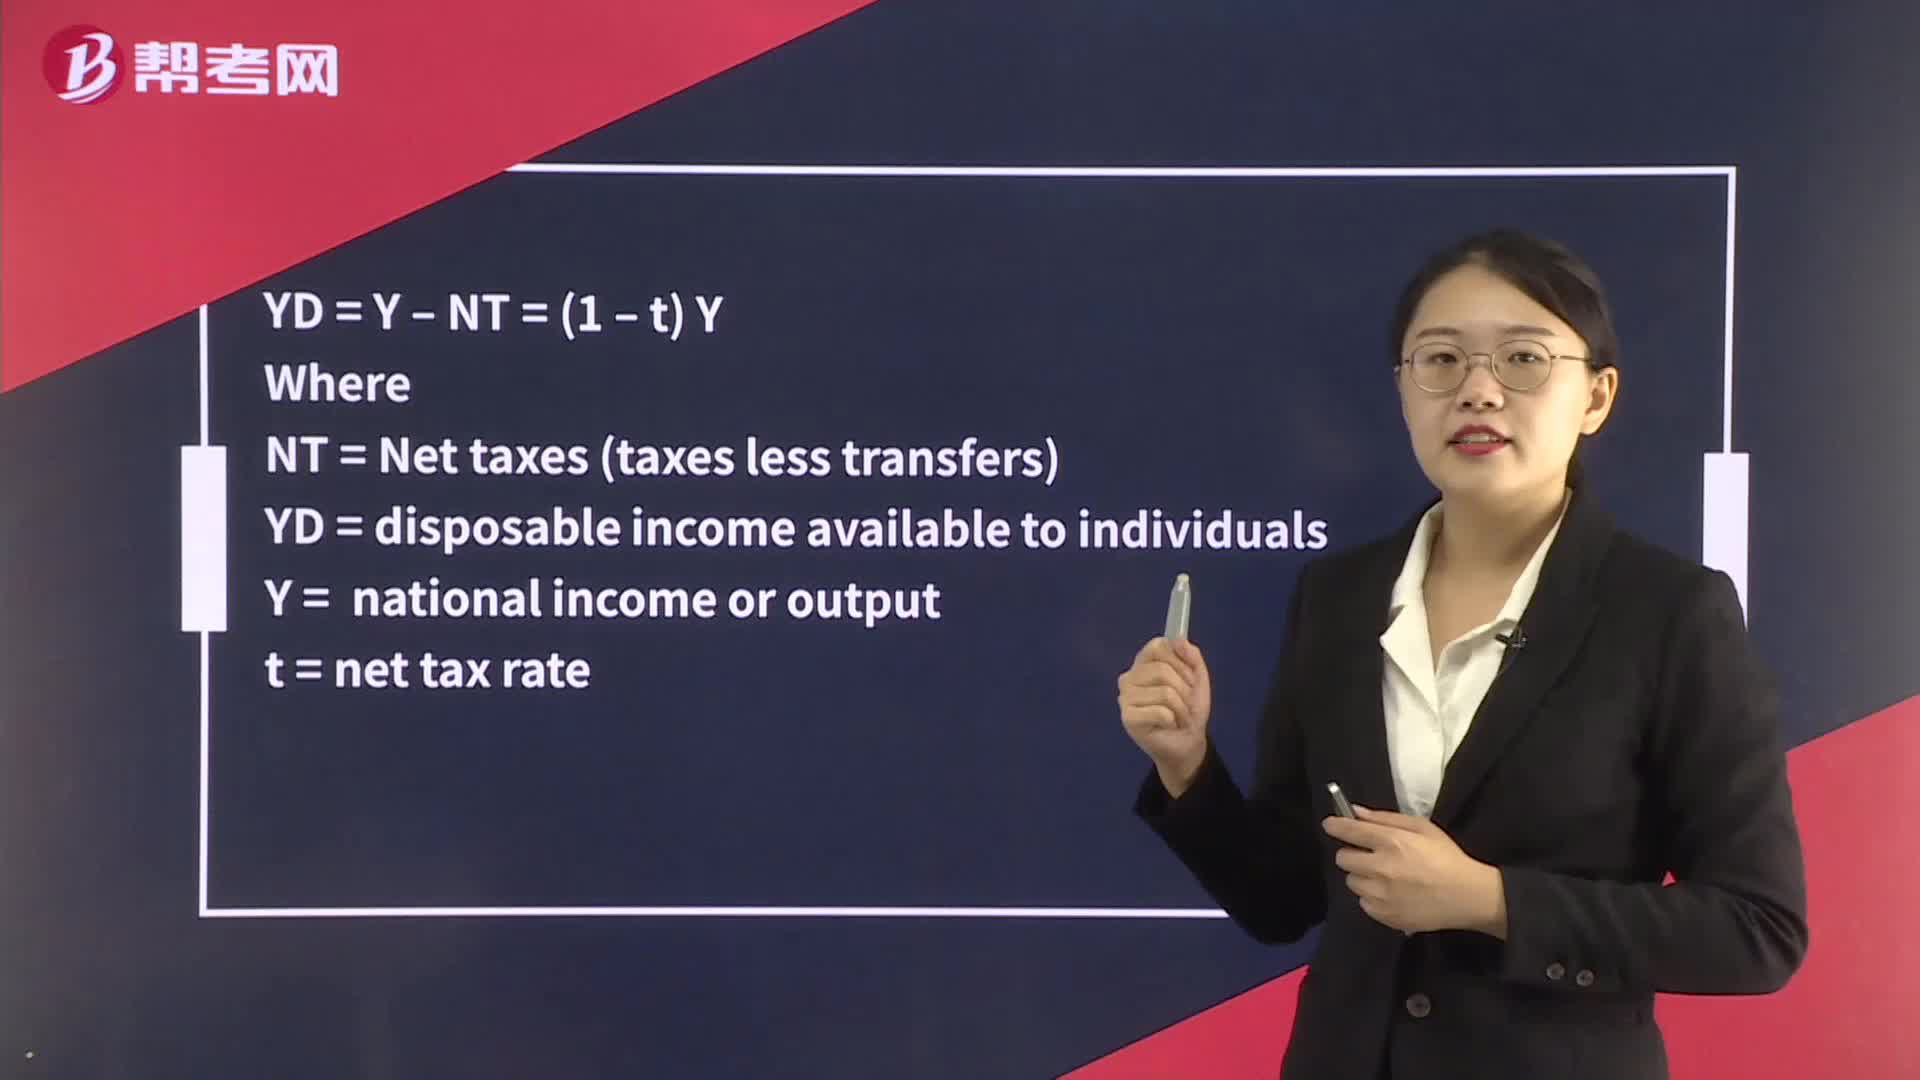
The Fiscal Multiplier:Wheret = tax rate
 04:25
04:25
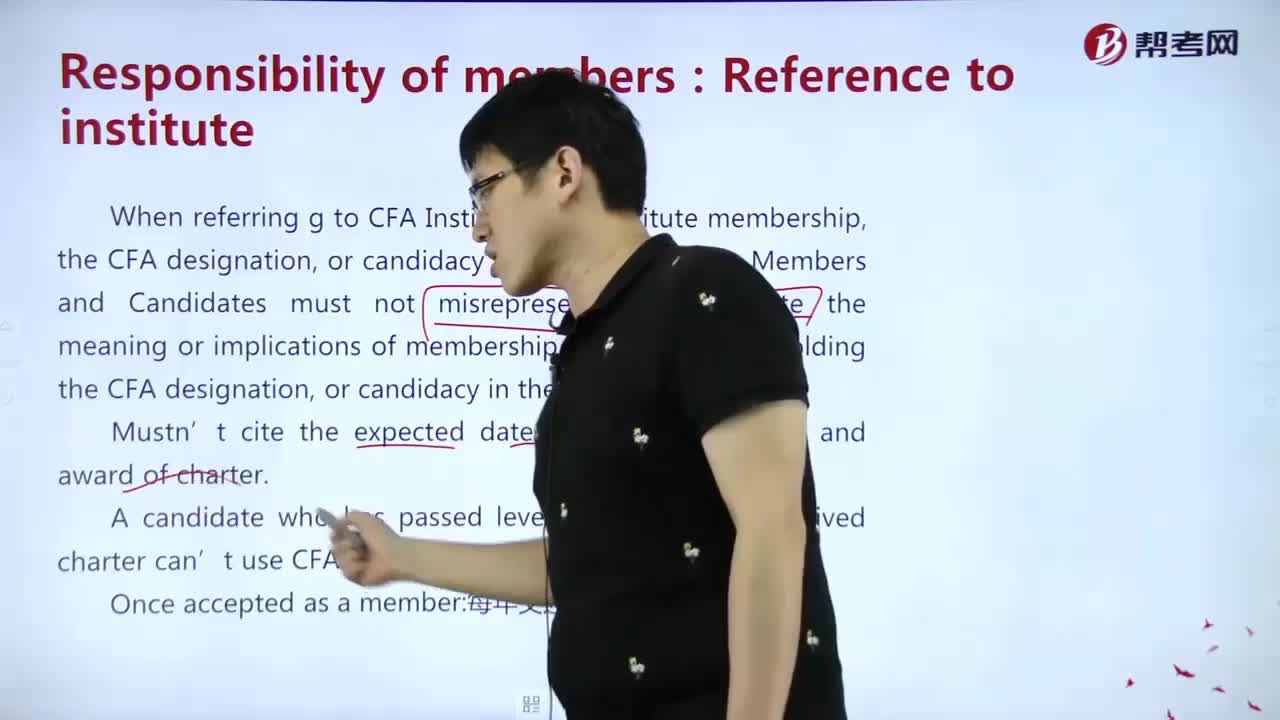
What are the responsibilities of the members in reference to the CFA Institute?:Once accepted as a member:每年交述职报告和年费but must not over promise the competency and future investment results.Case
 09:59
09:59
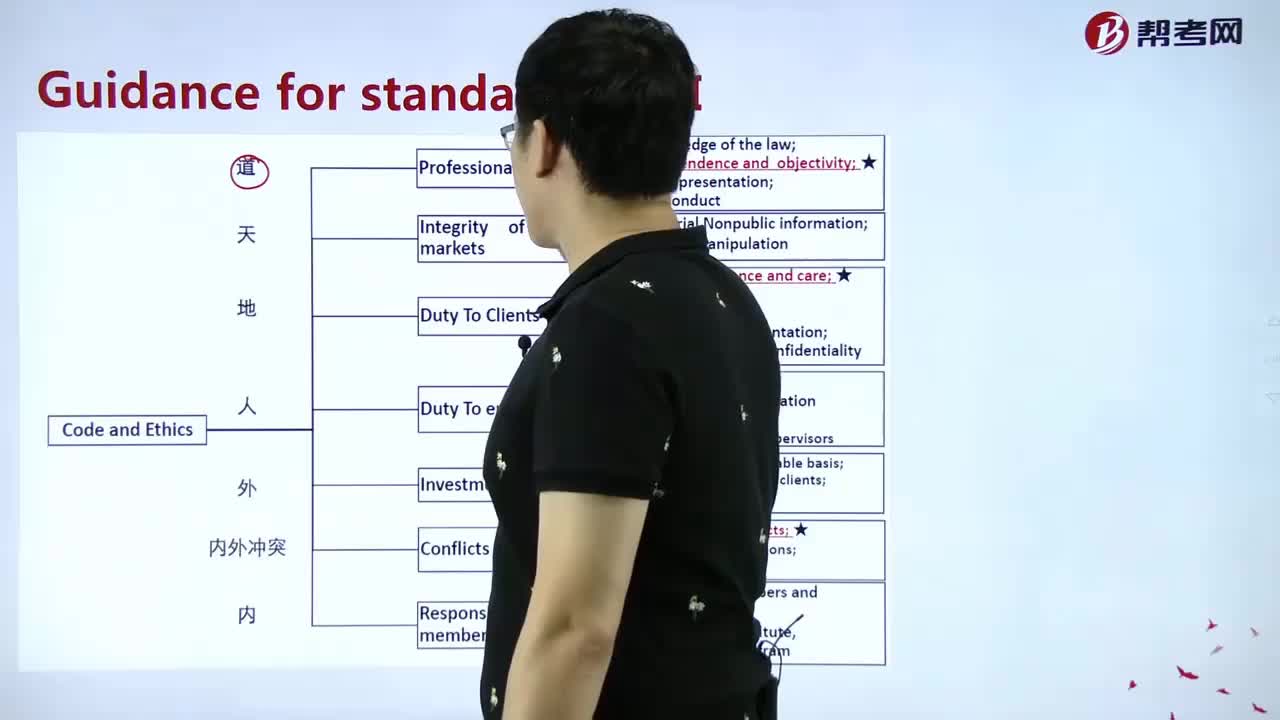
How to understand the guidance for Standards I–VII?:A.Promote financial integrity ad seek to prevent sand punish abuses in the financial markets,
