CFA考试相关视频
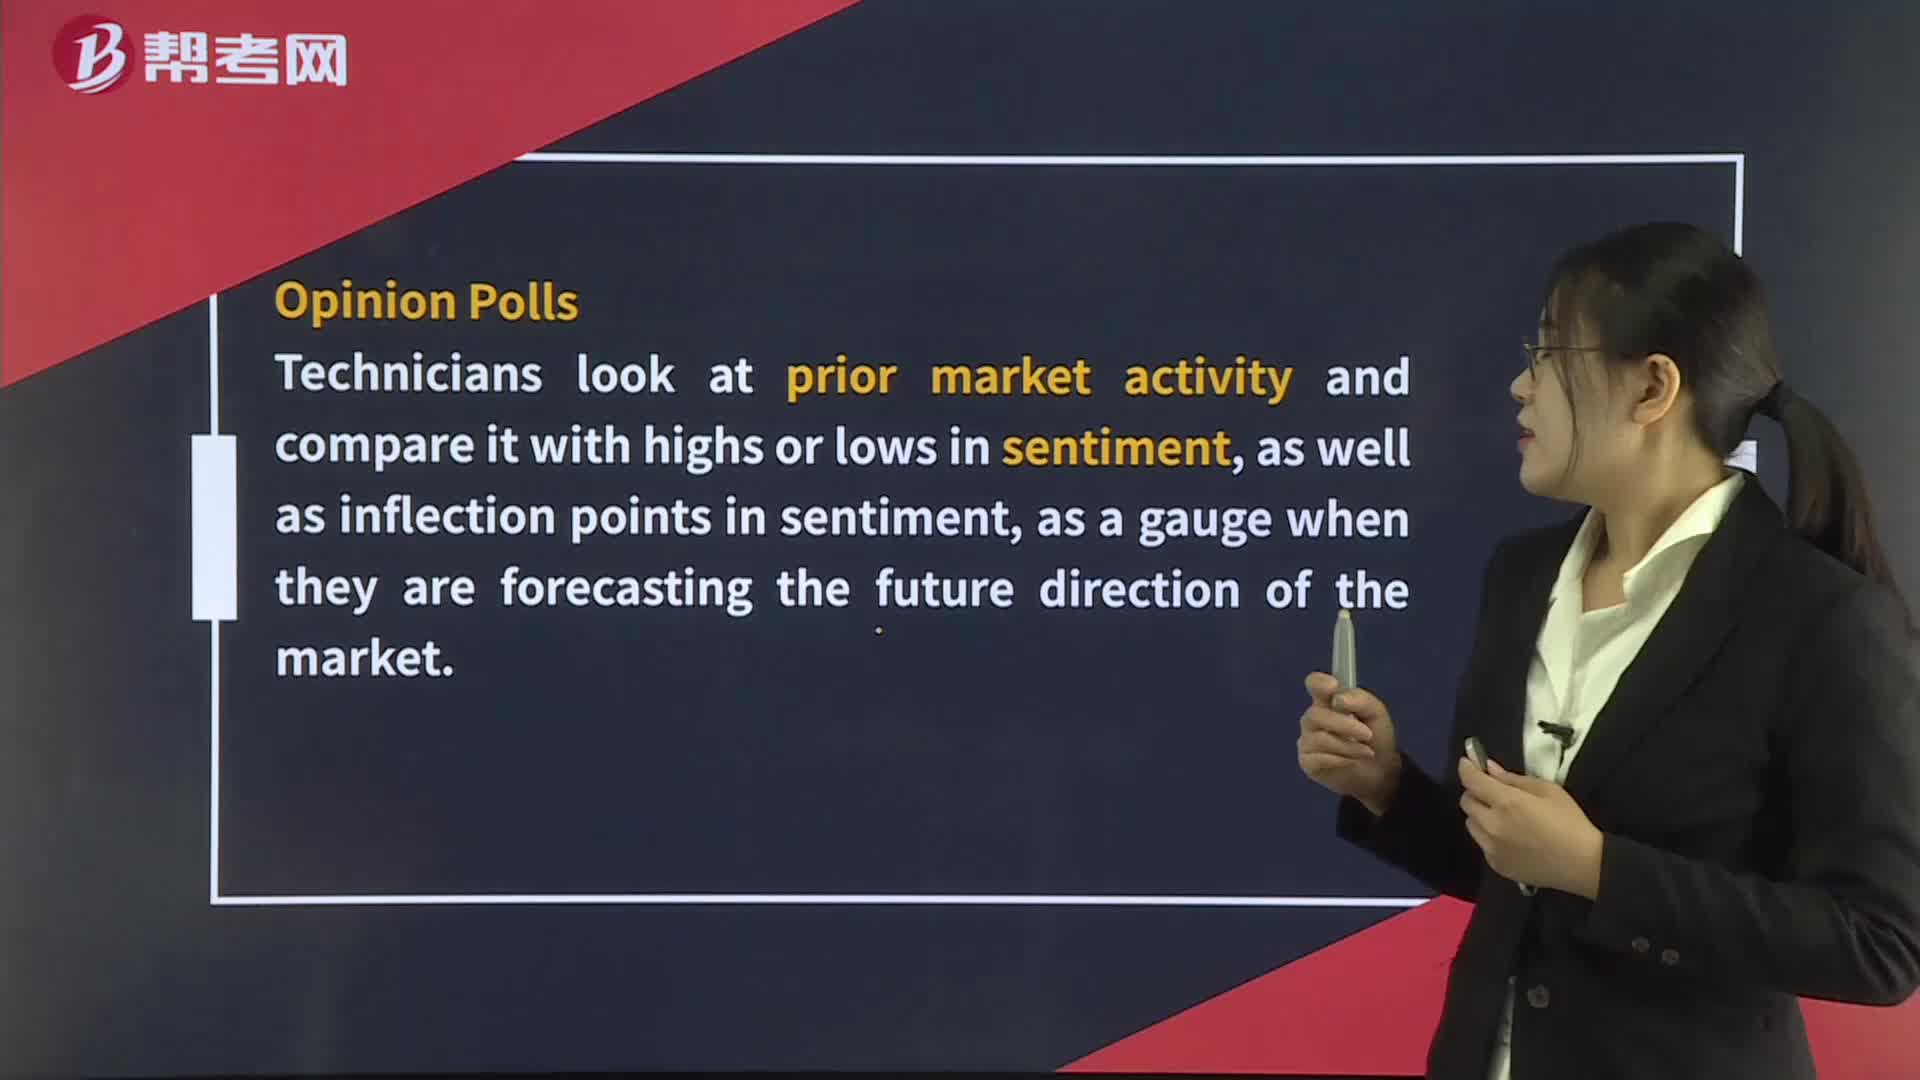
Technical Indicators— Sentiment indicators
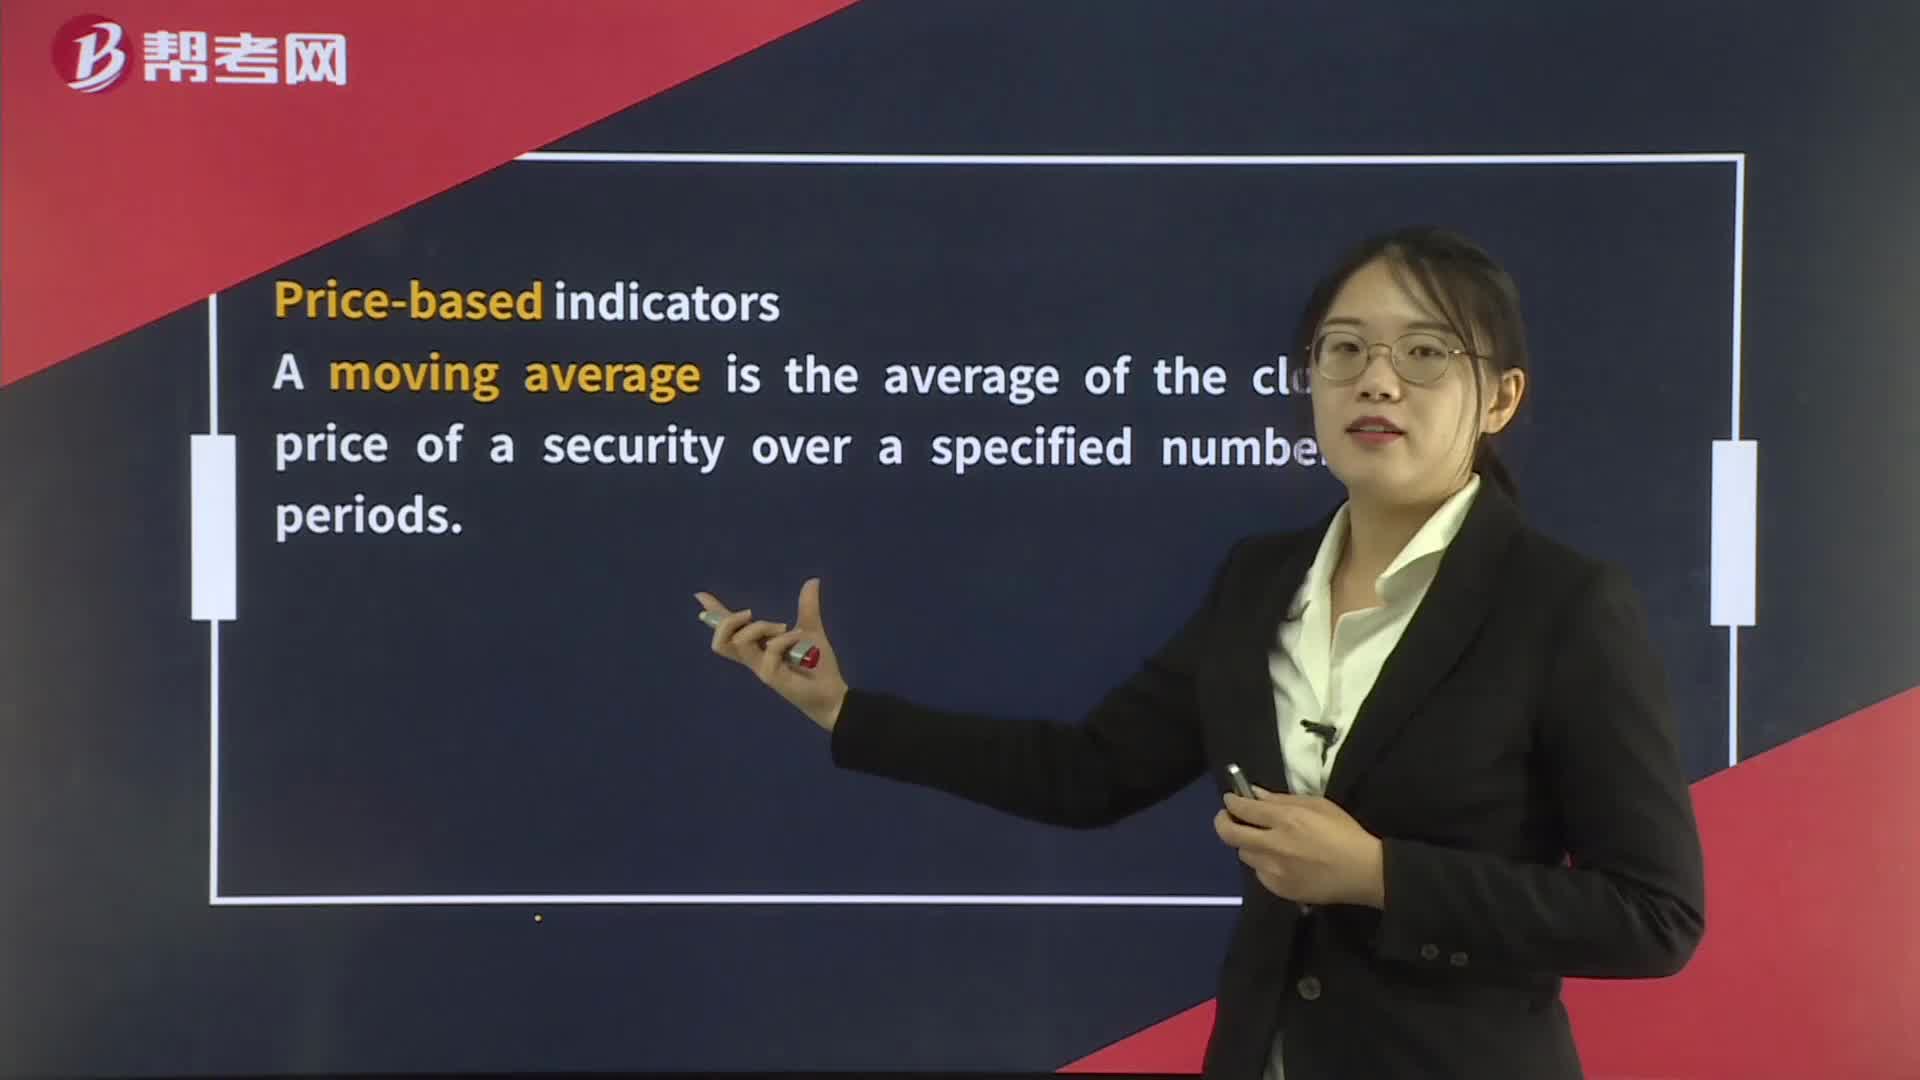
Technical Indicators— Price-based Indicators

Technical Indicators— Momentum Oscillators
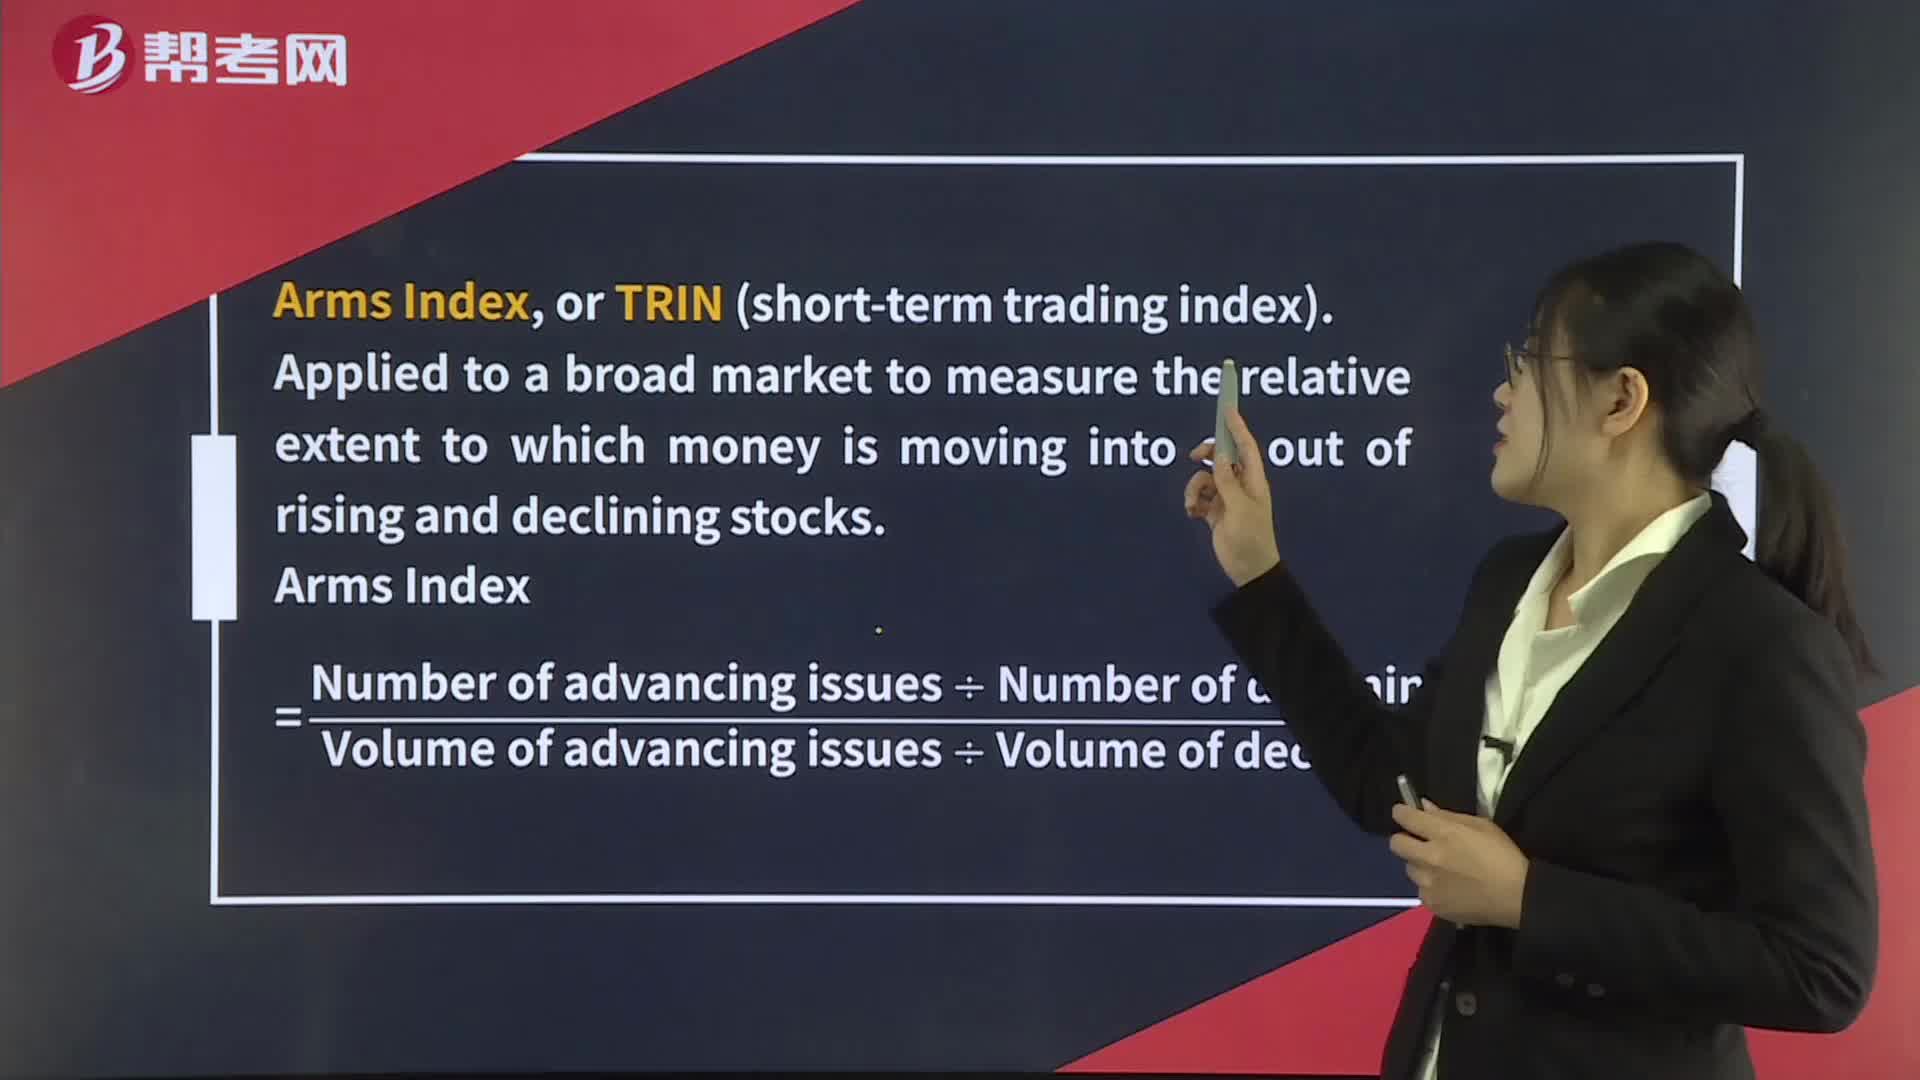
Technical Indicators— Flow-of-Funds Indicators
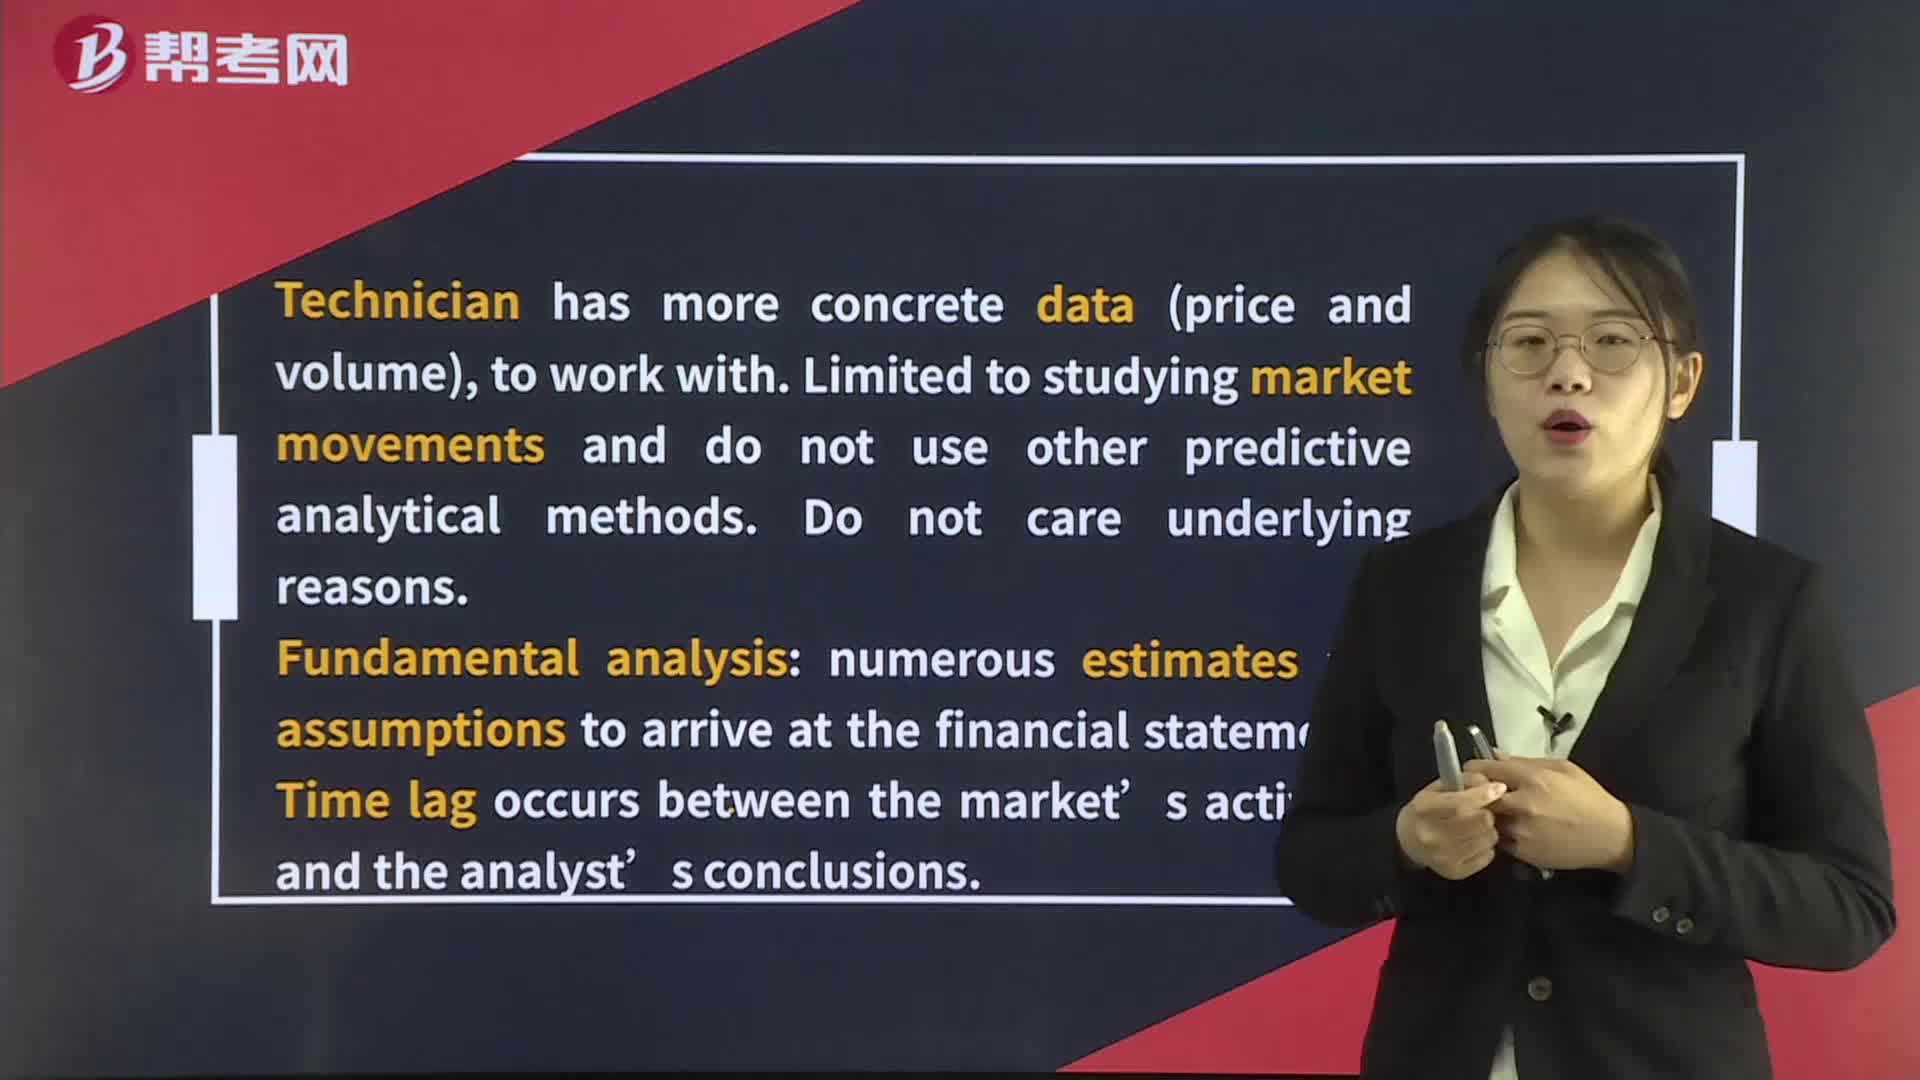
Technical and Fundamental Analysis
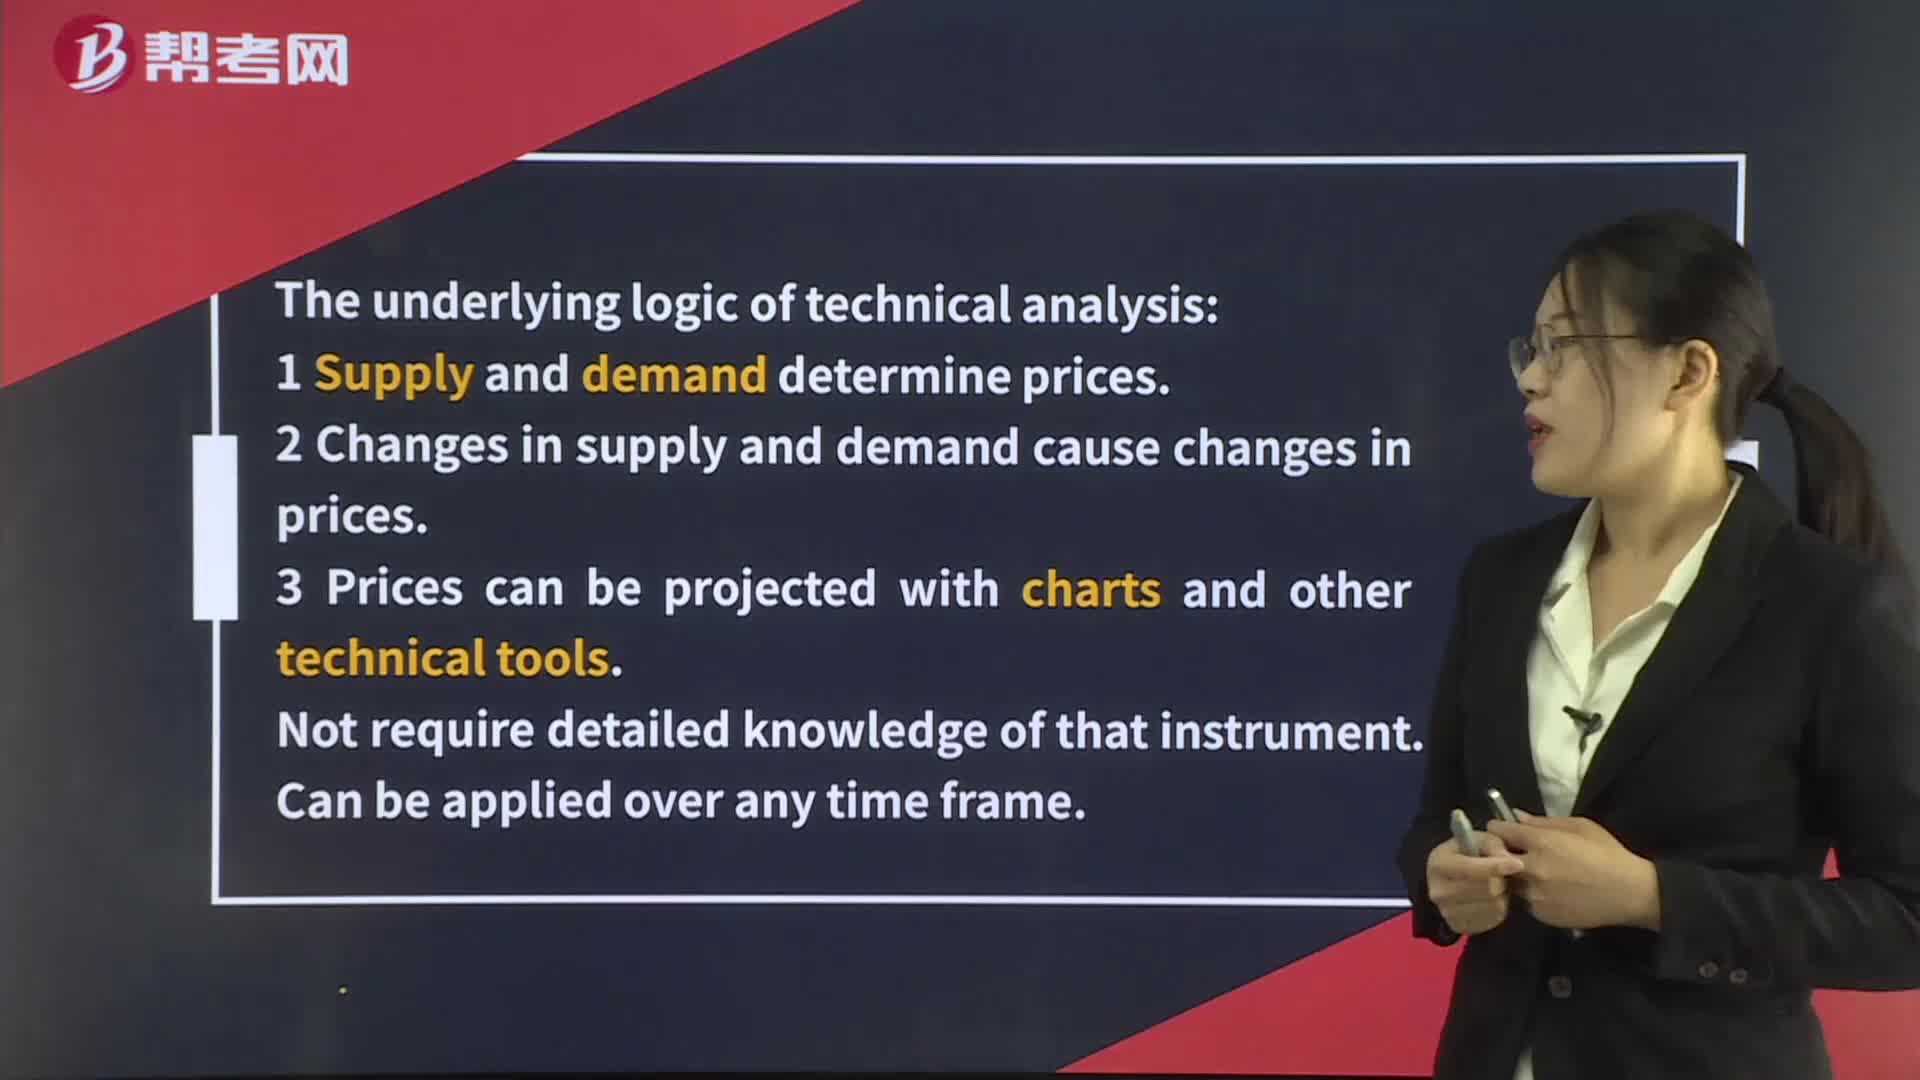
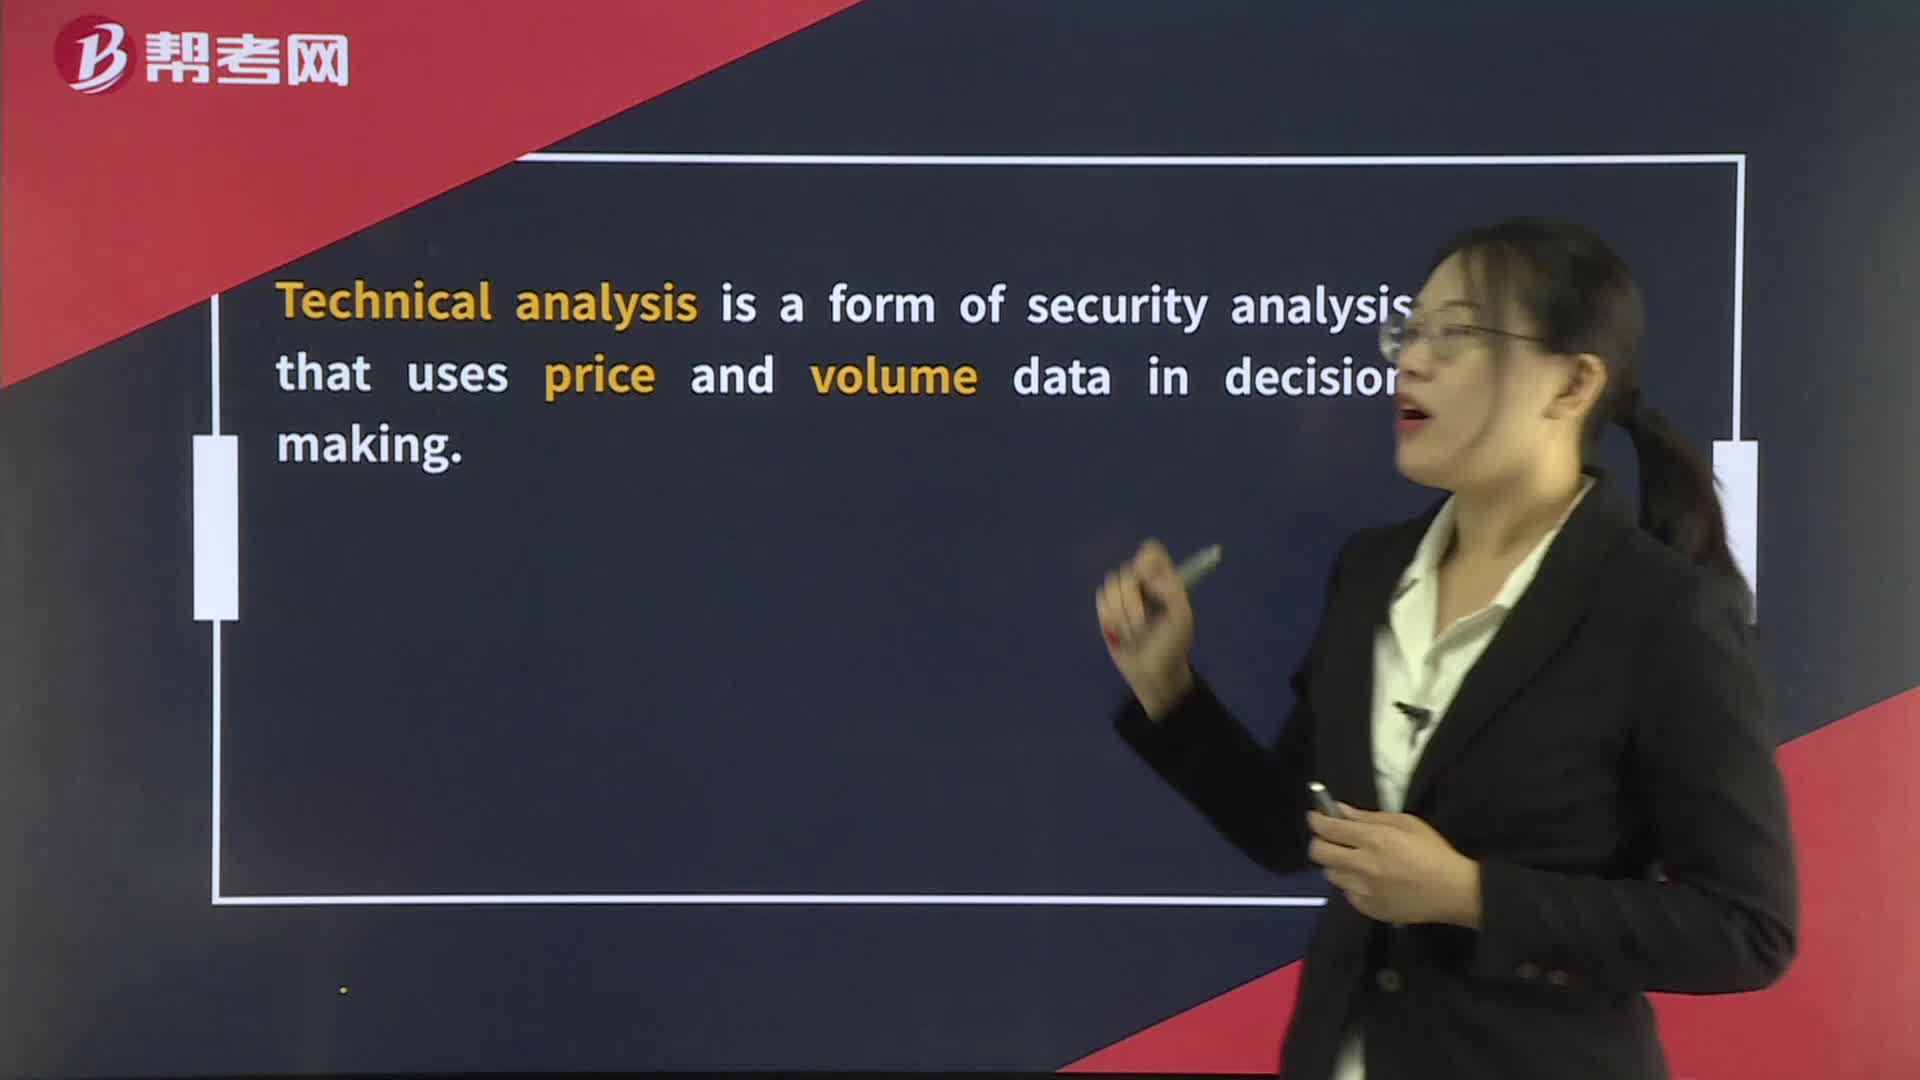
Technical Analysis
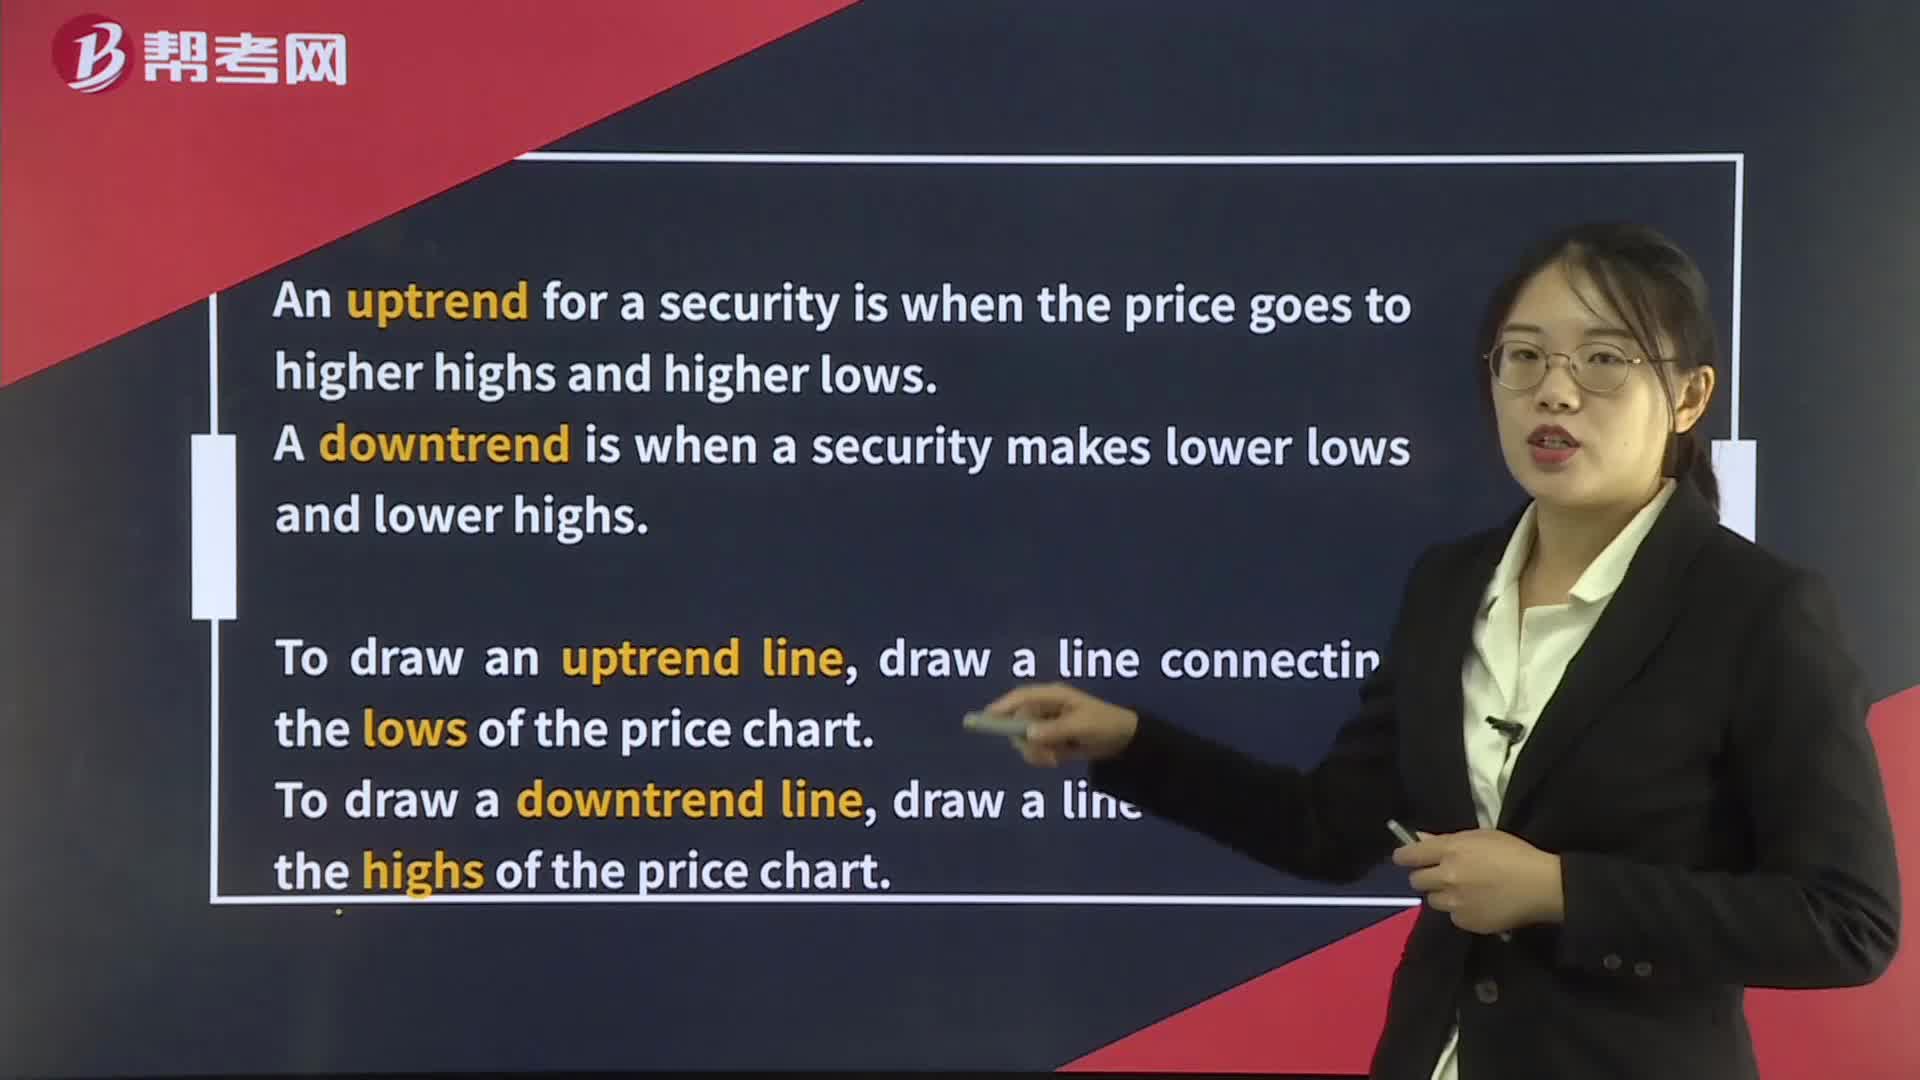
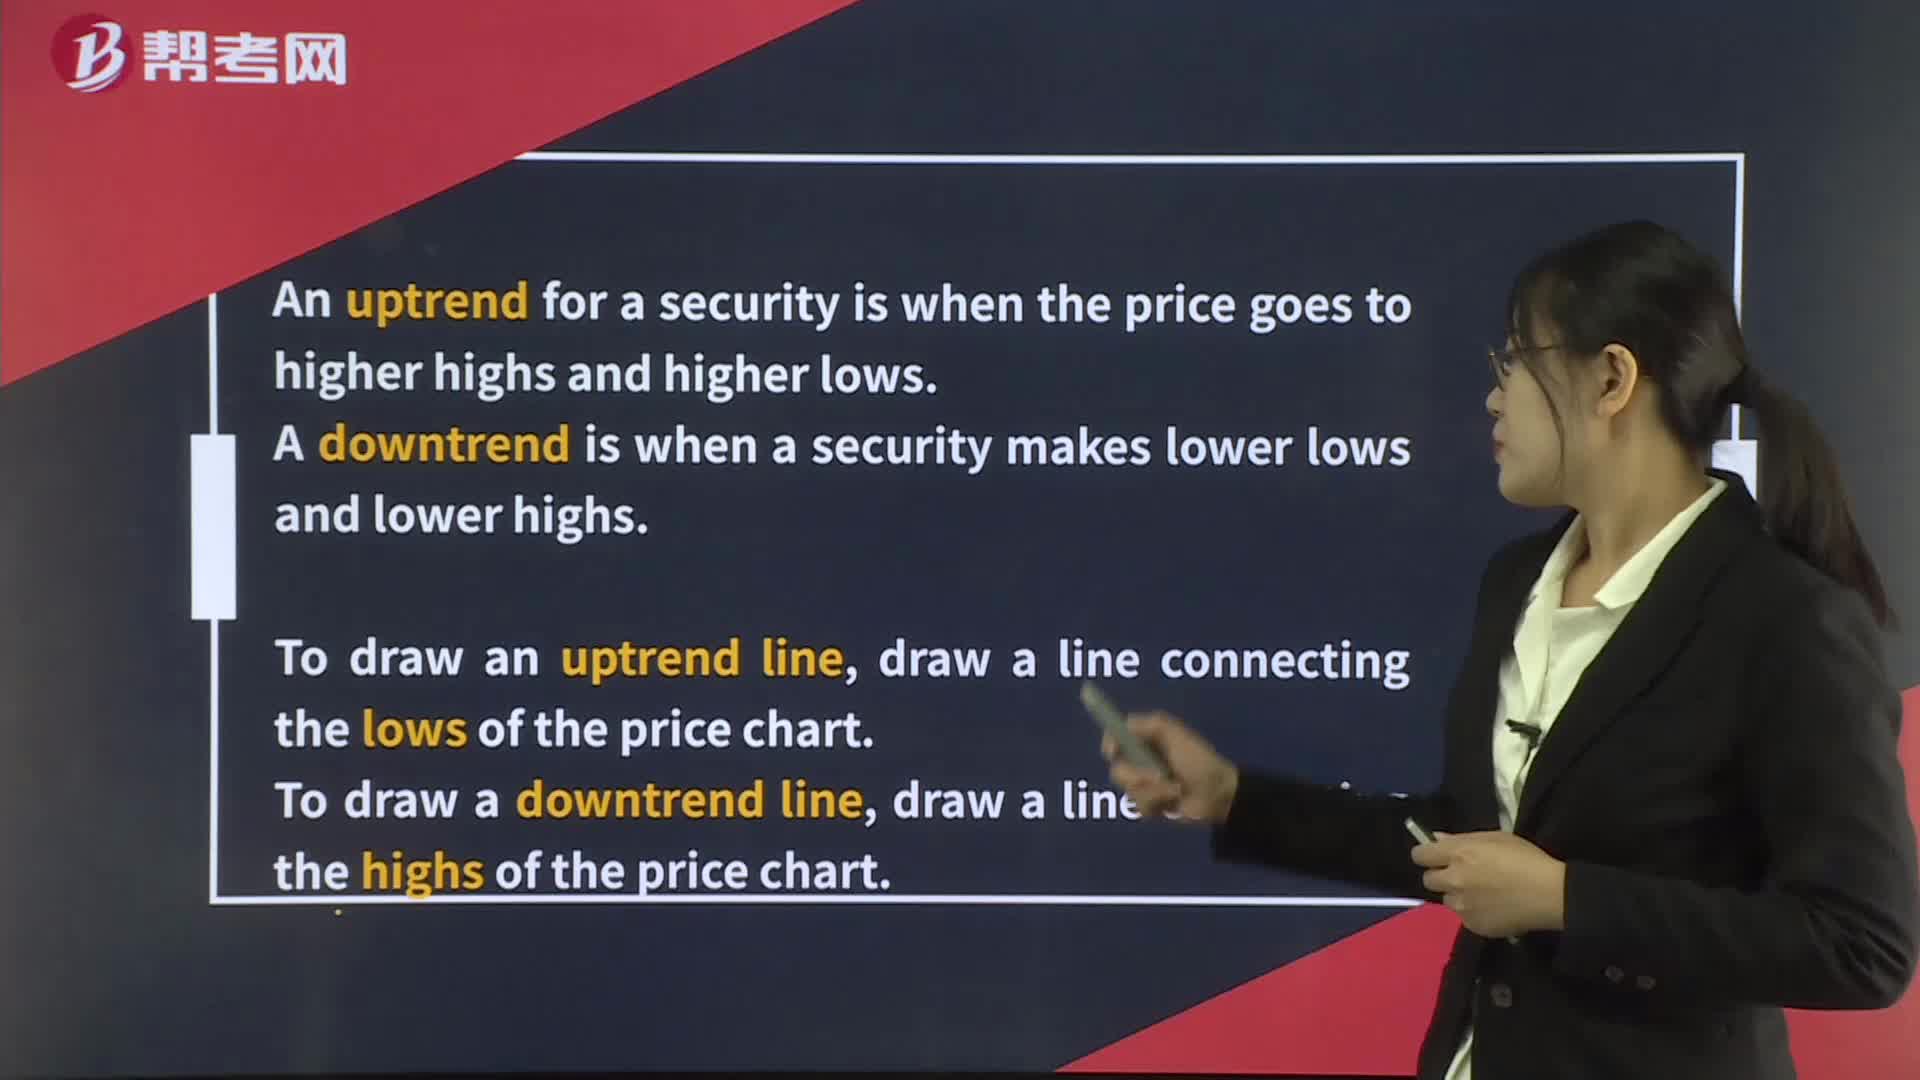
Technical Analysis Tools— Trend
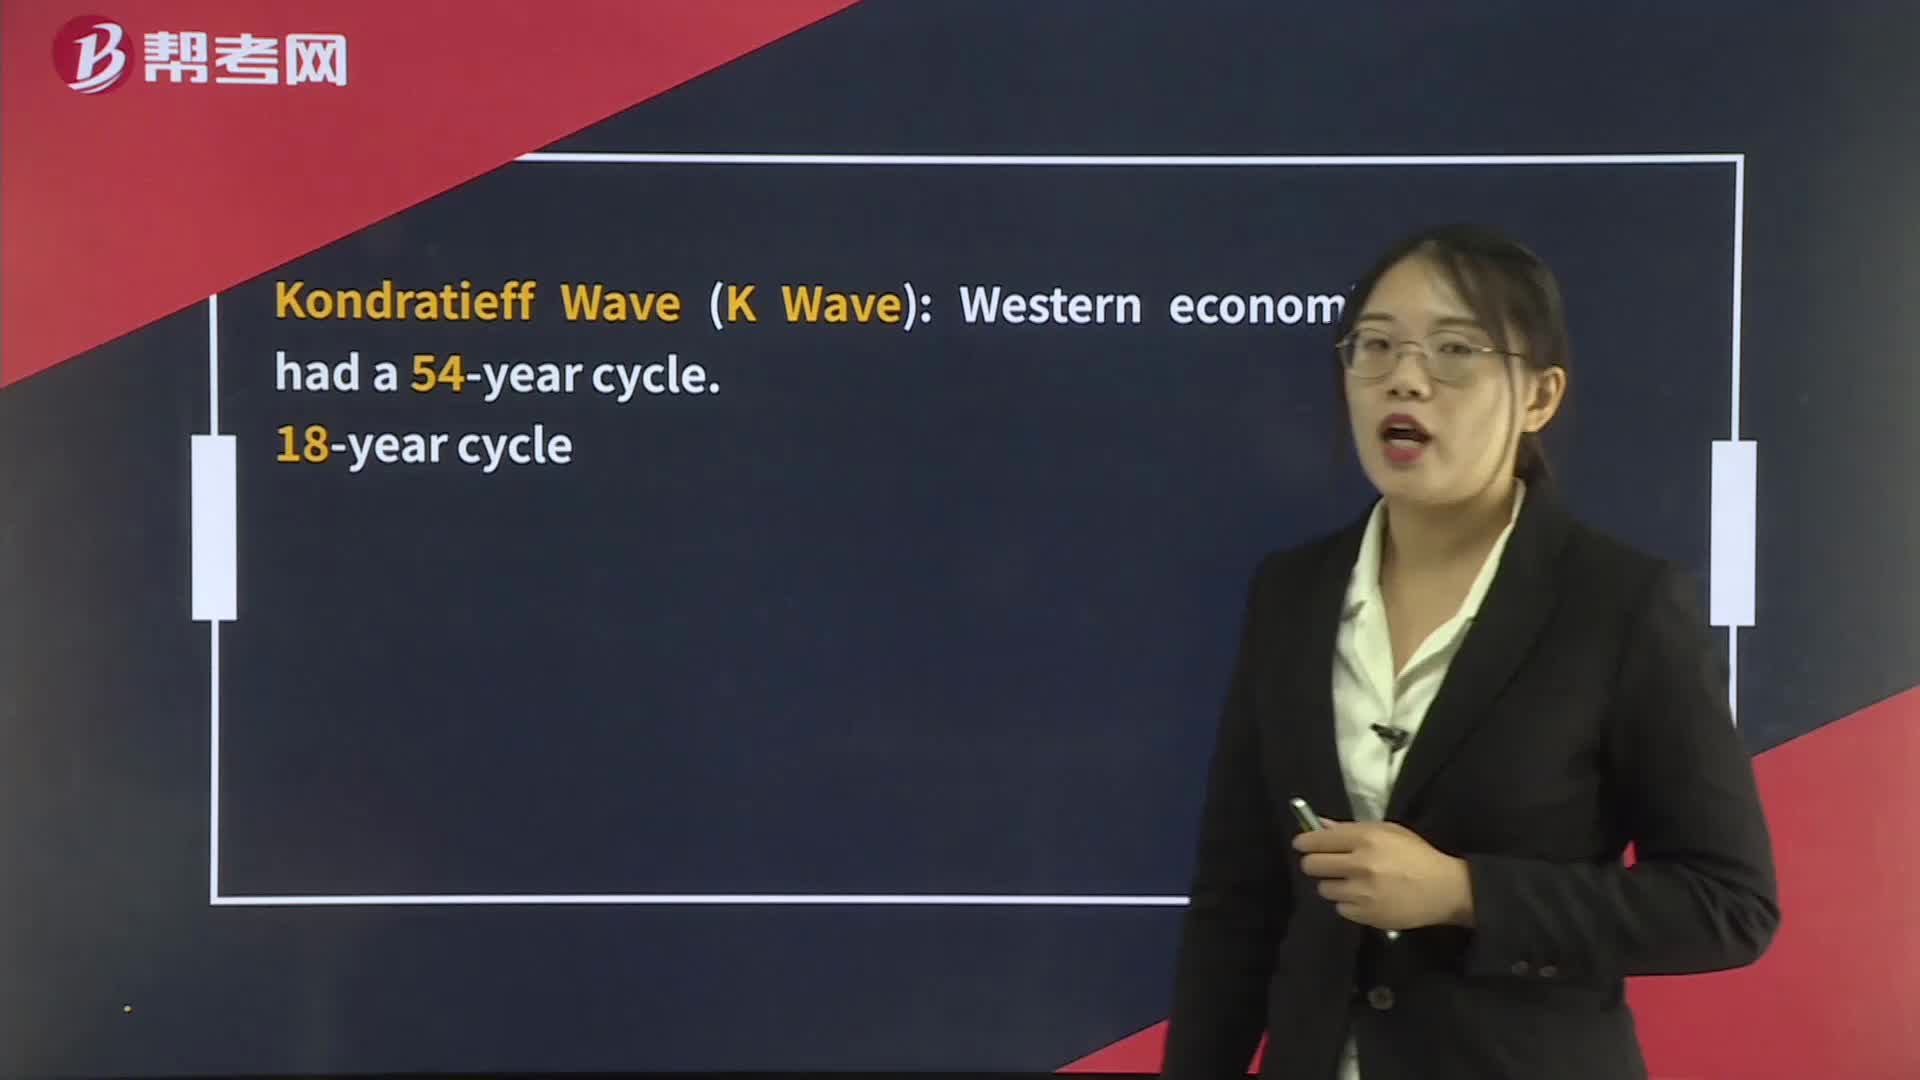
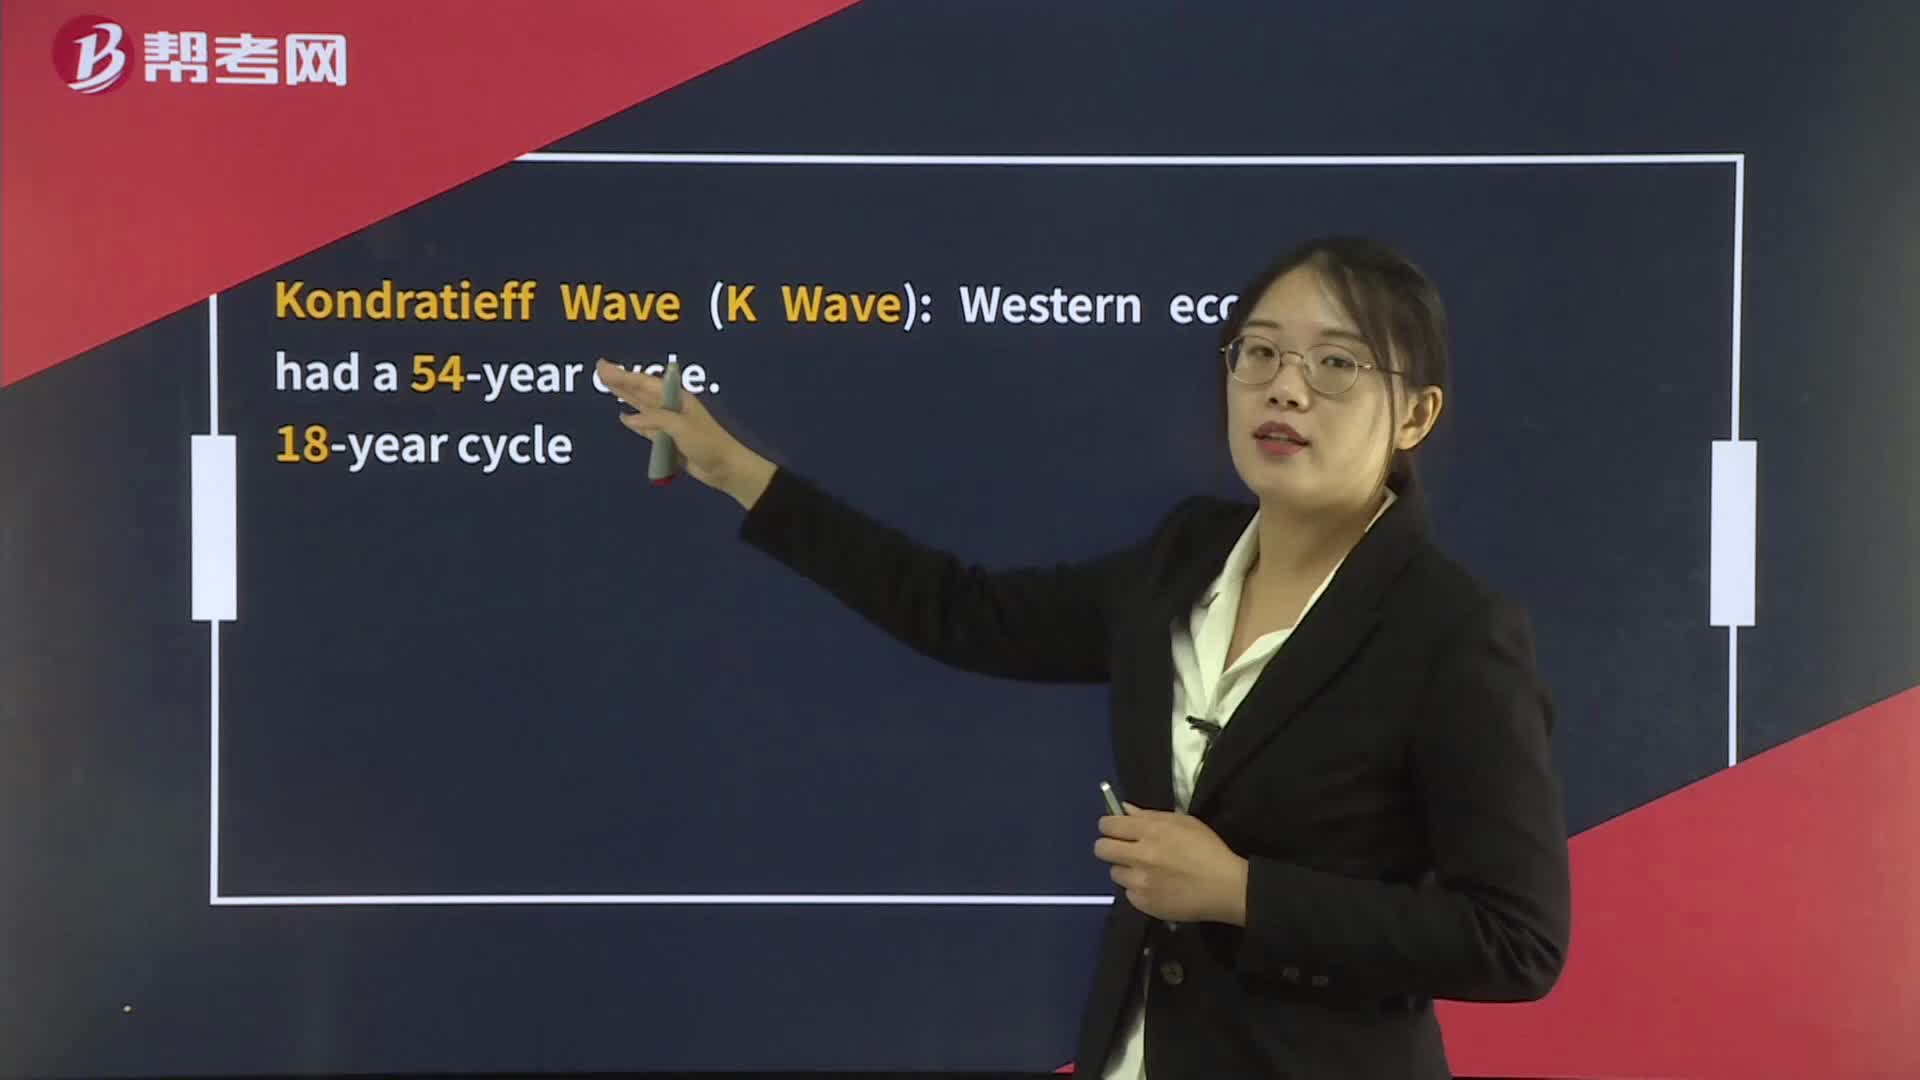
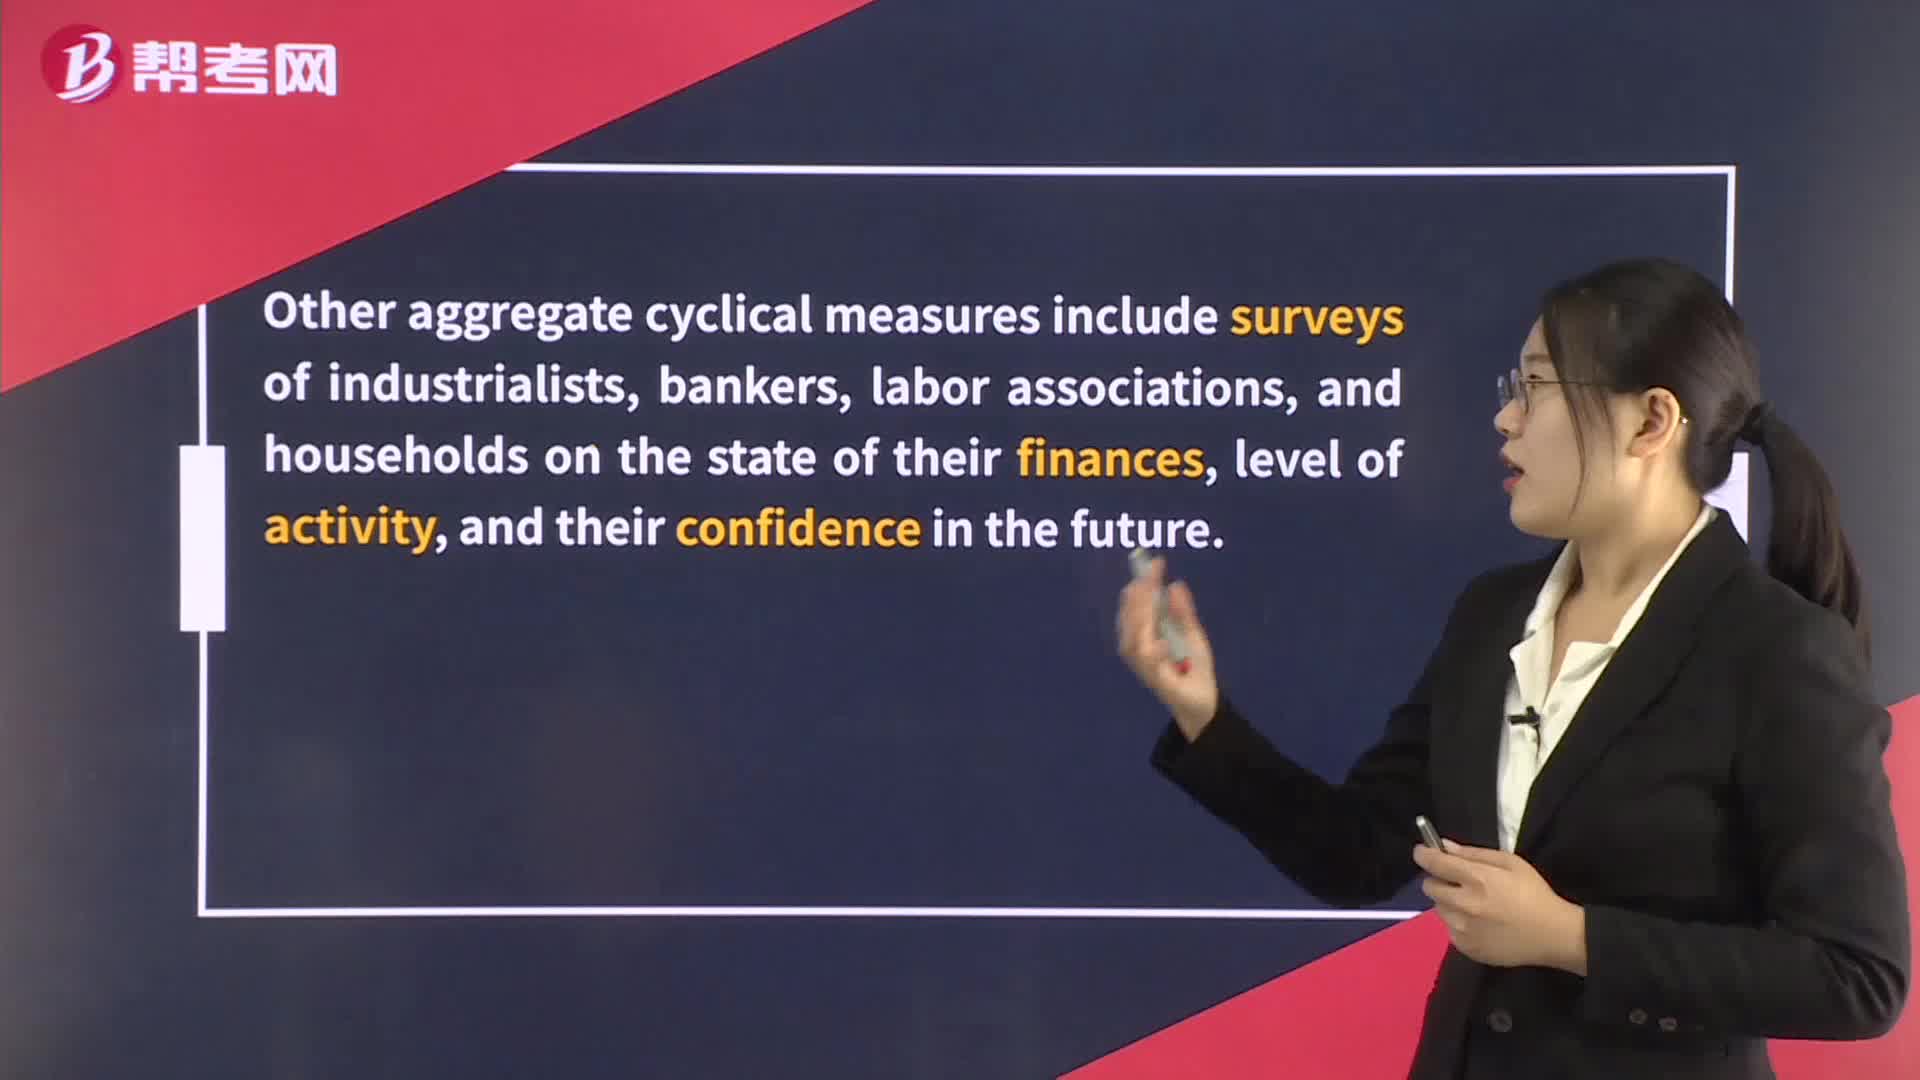
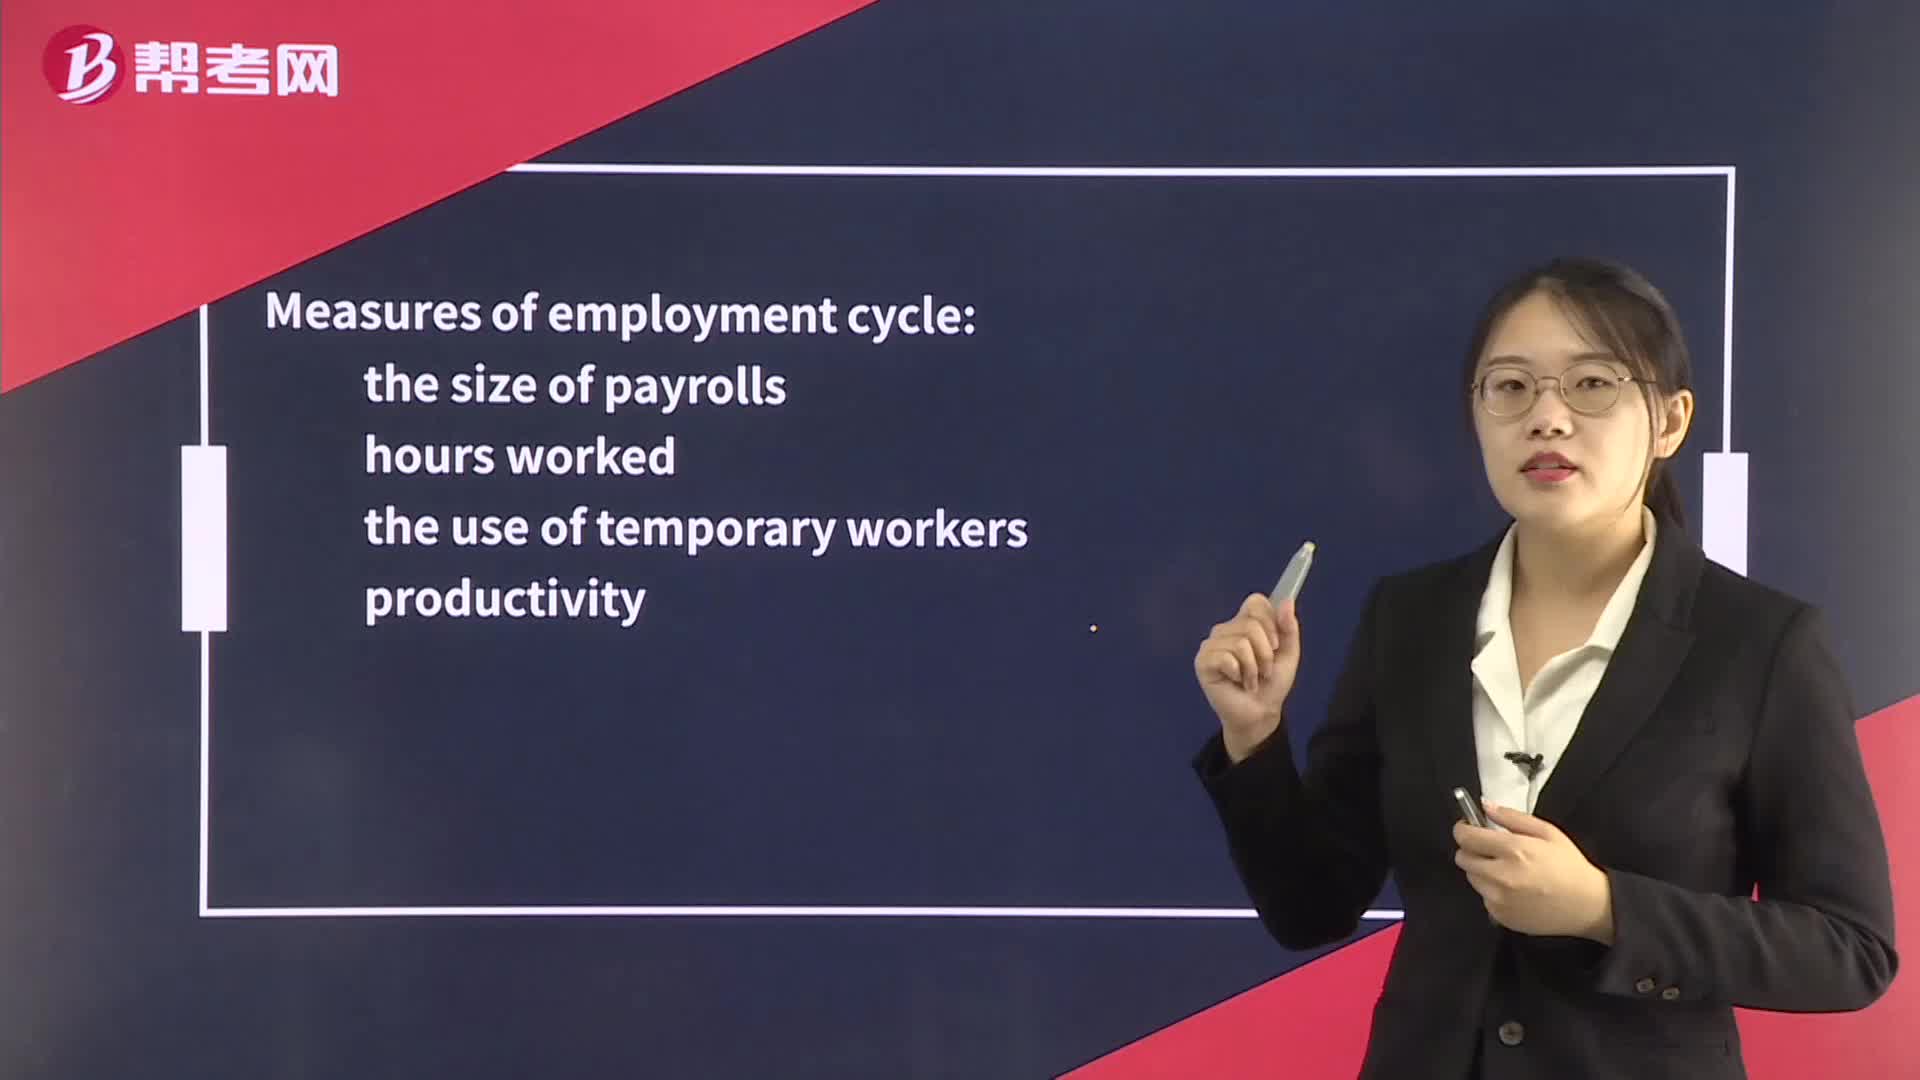
Technical Analysis Tools— Cycles
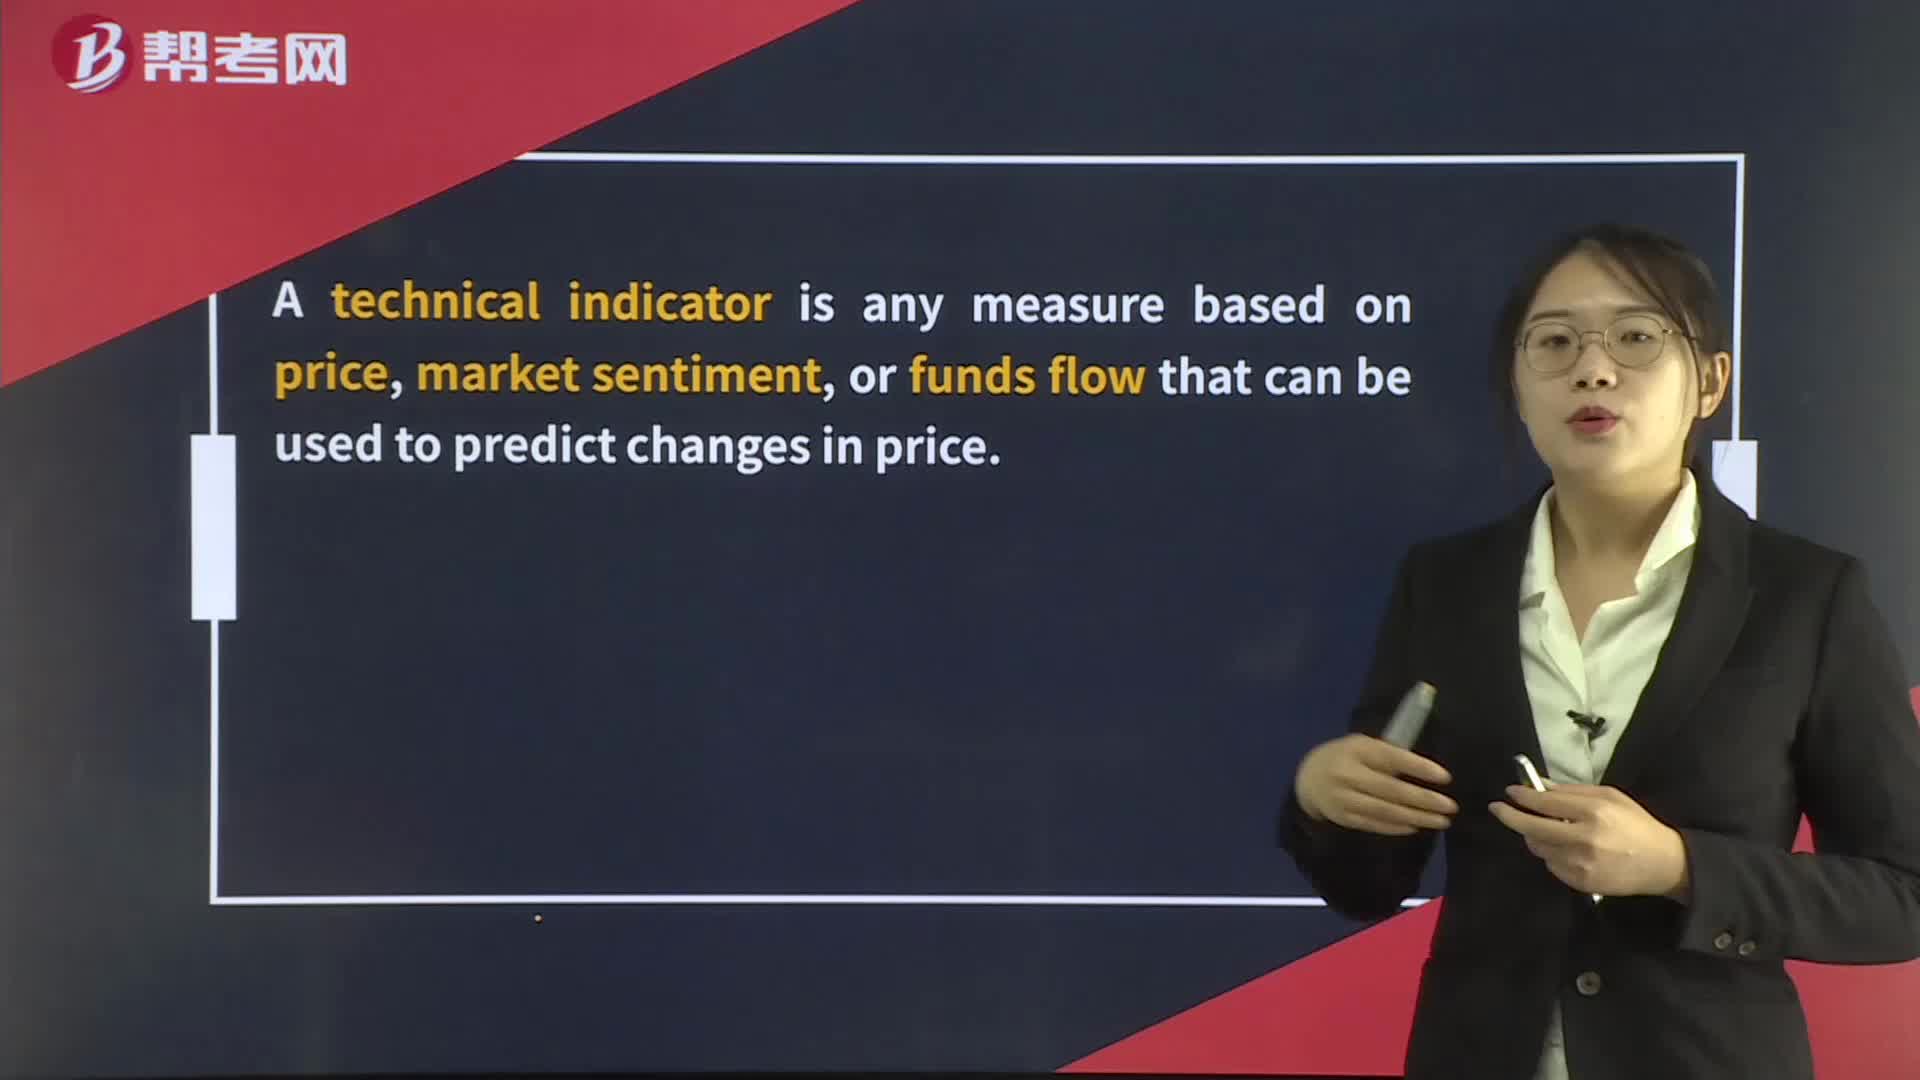
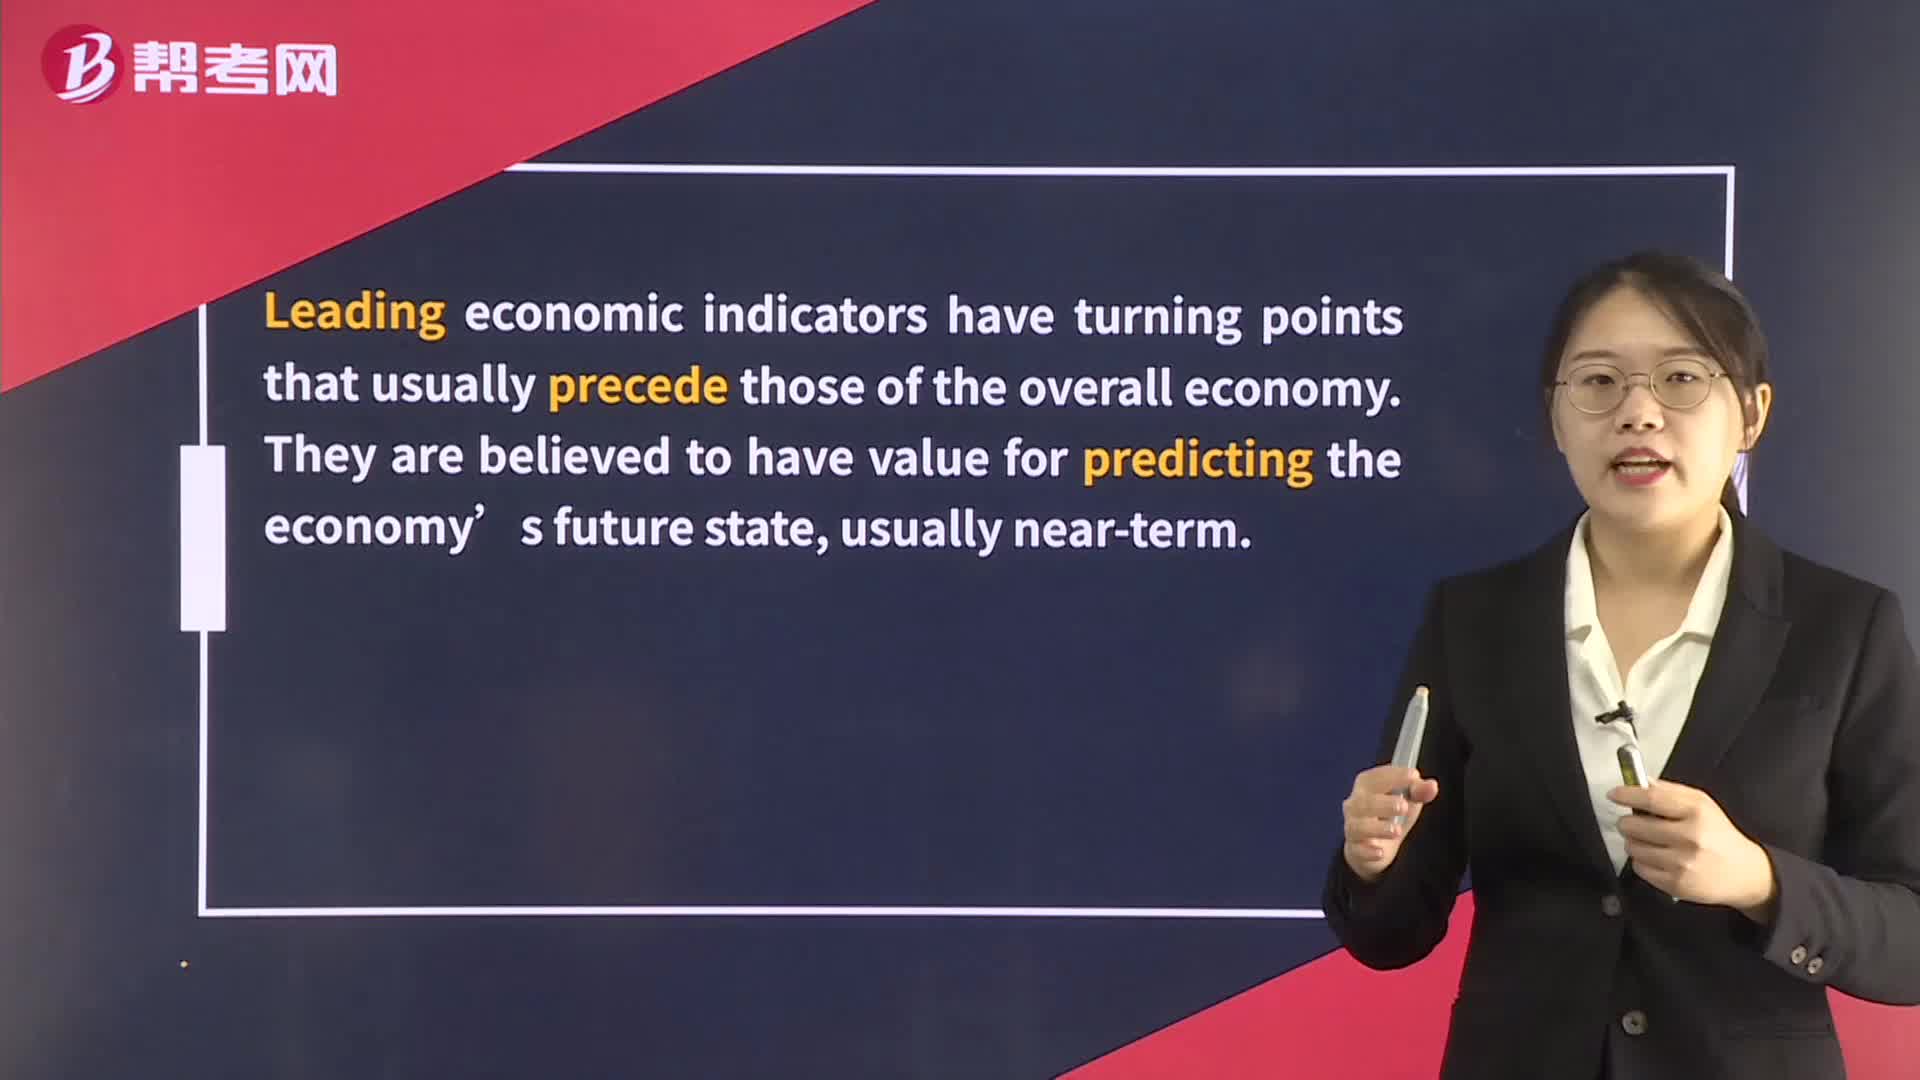
Technical Analysis Tools— Technical Indicators
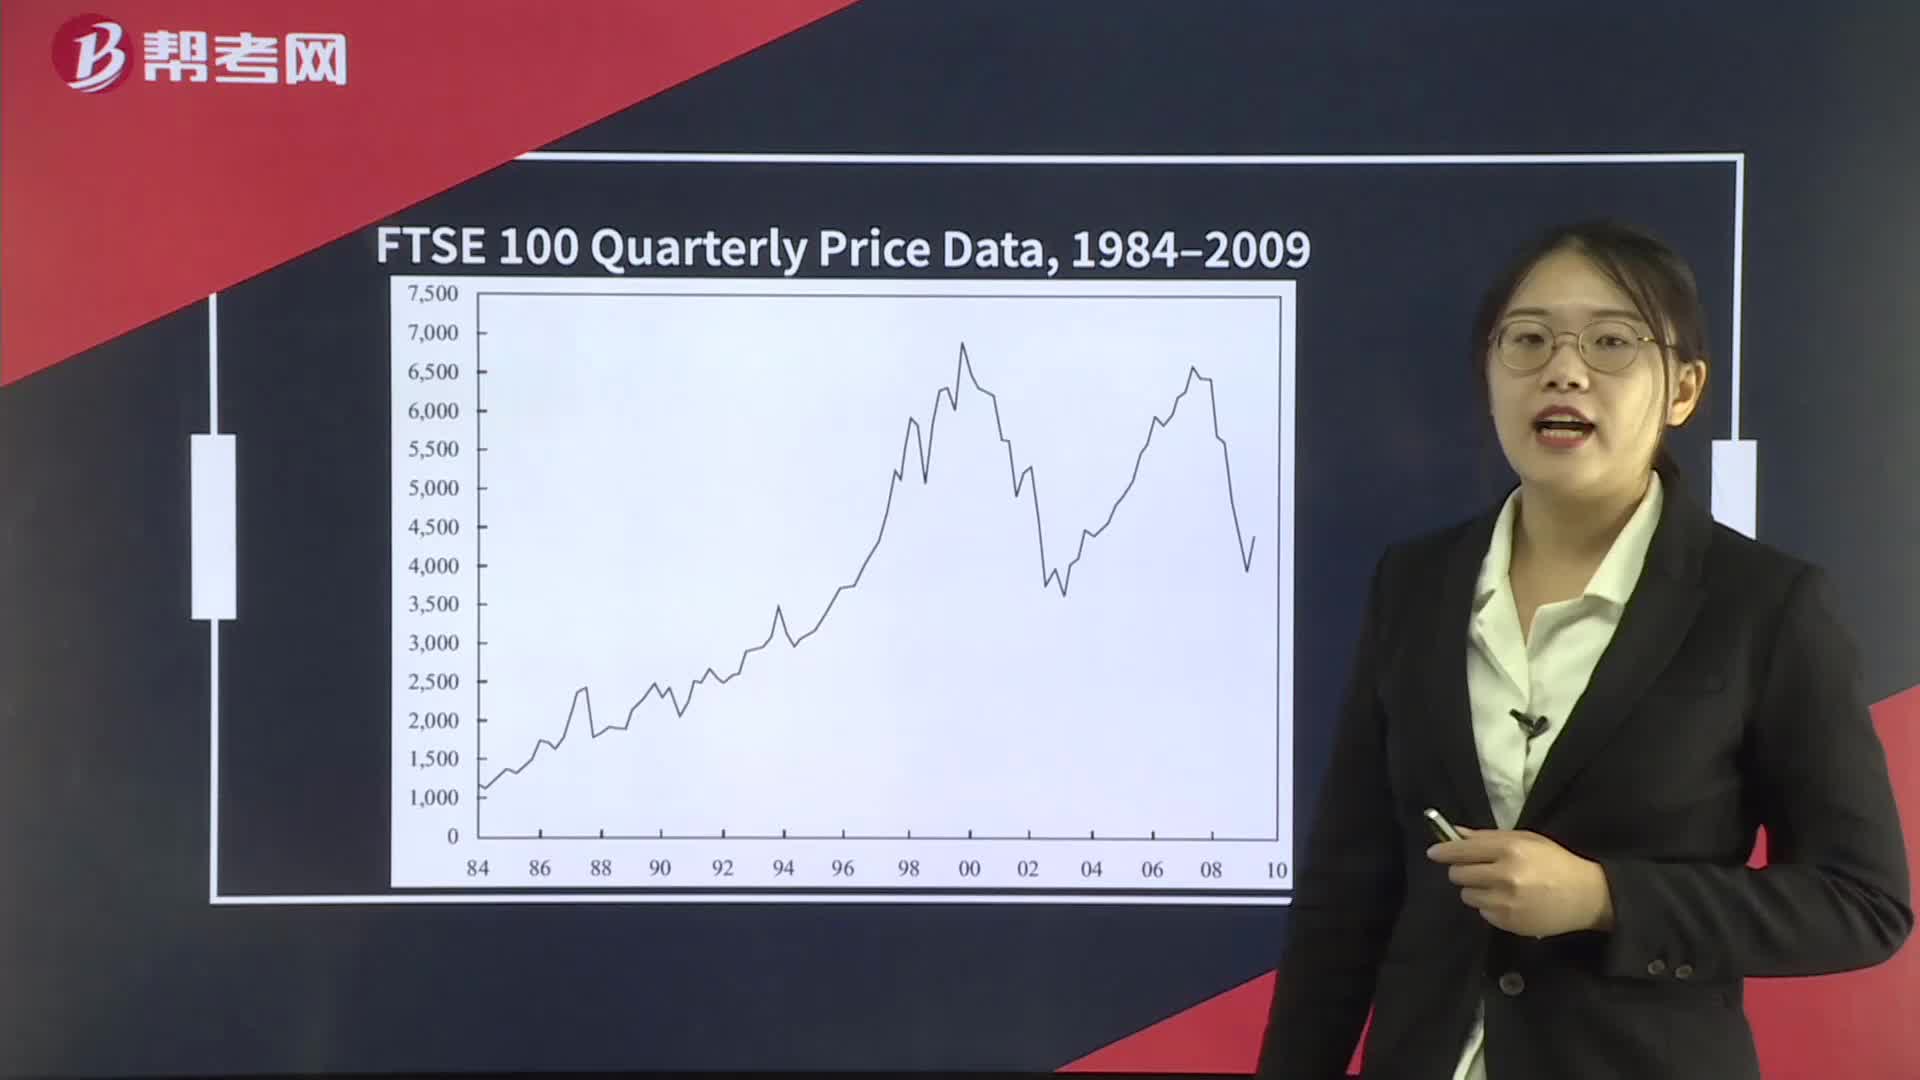
Technical Analysis Tools— Charts
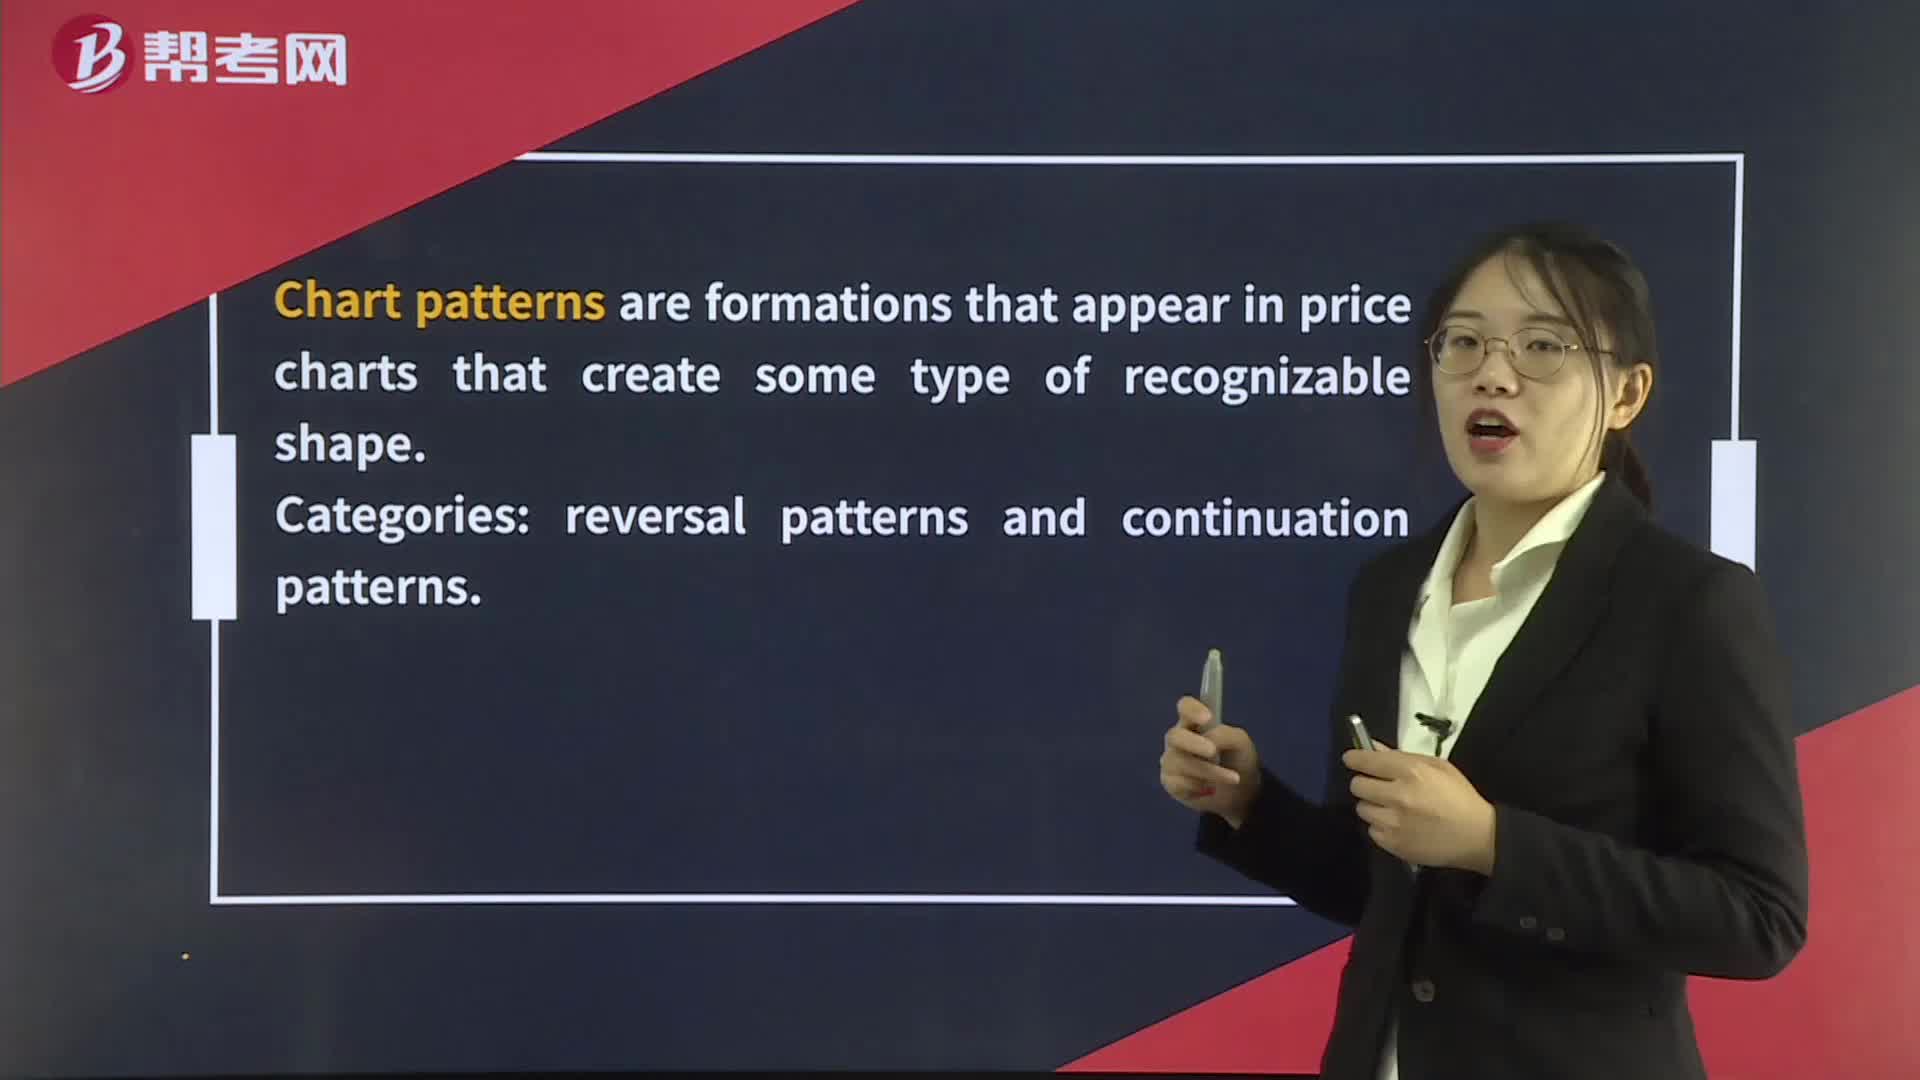
Technical Analysis Tools— Chart Patterns
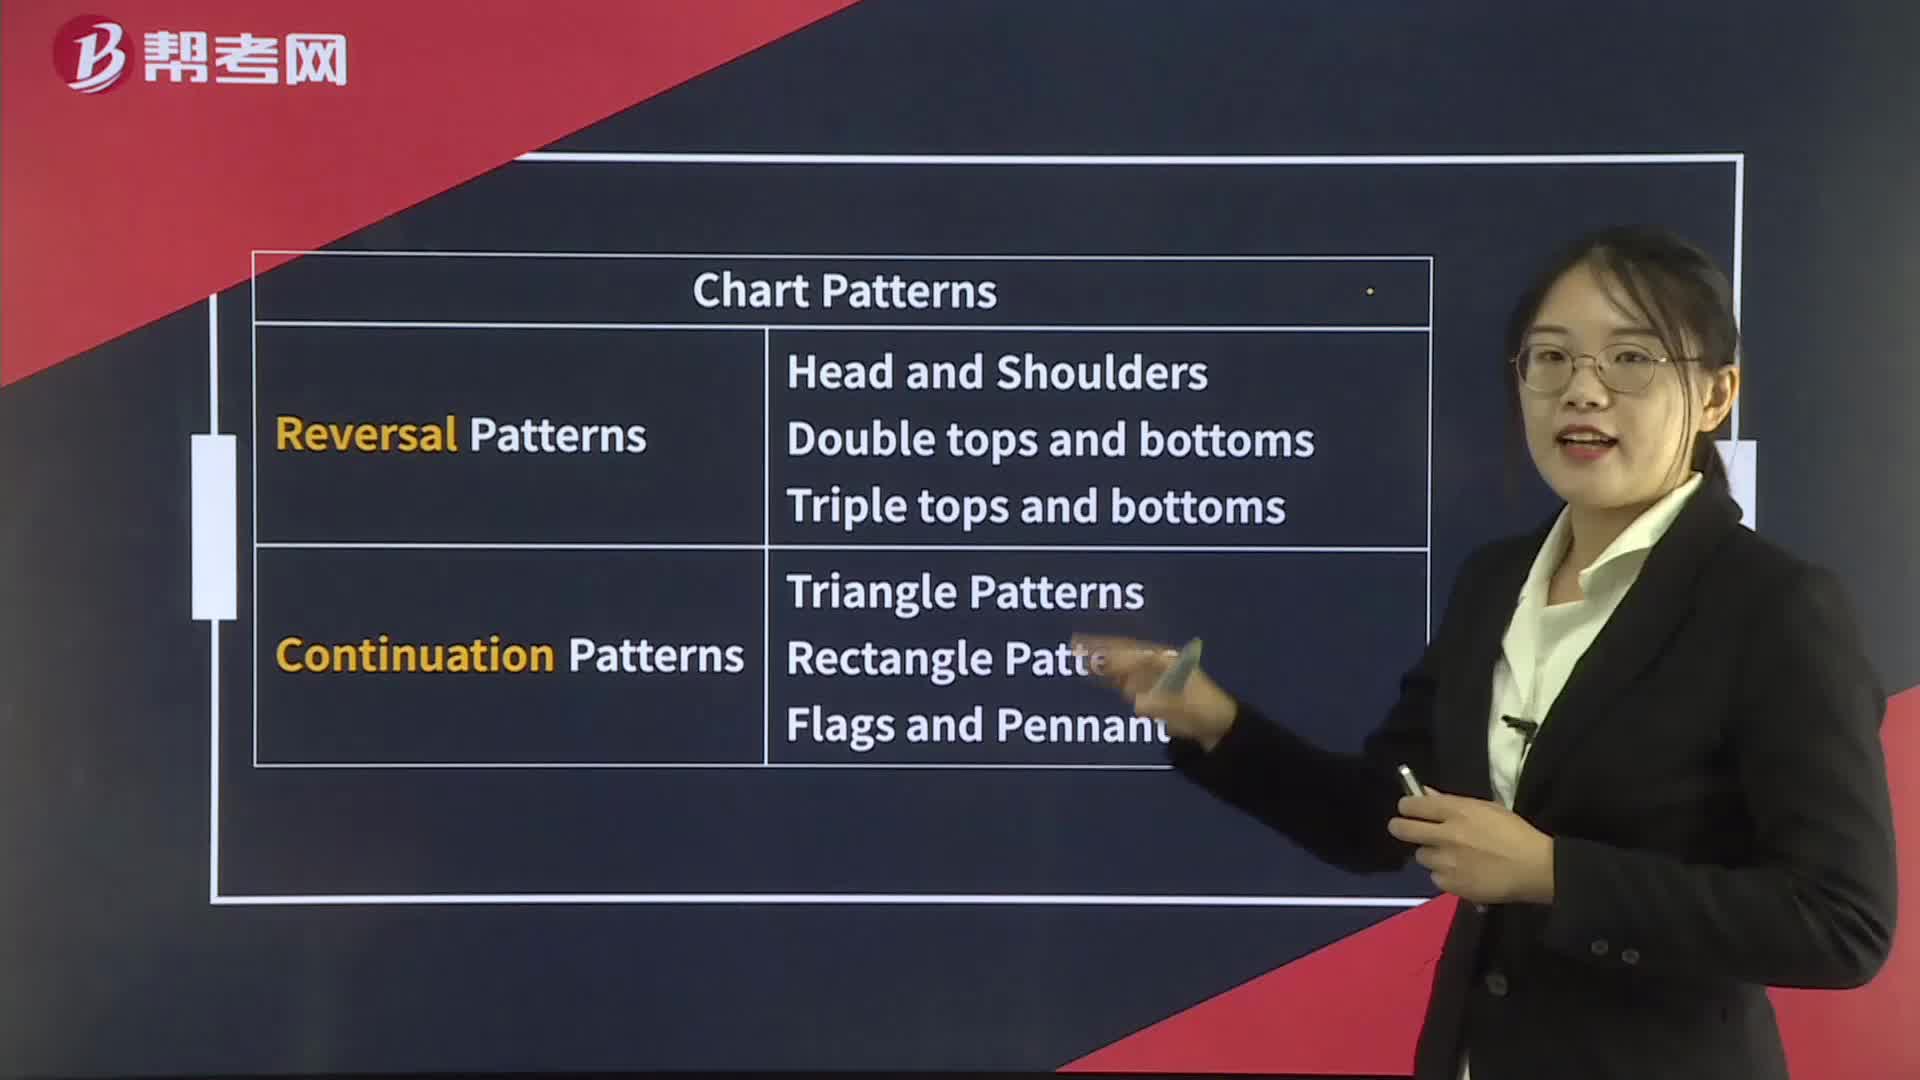
Technical Analysis Tools— Chart Patterns Summary