Technical Indicators— Price-based Indicators
357 播放时长:400
加载播放器...
Simple moving average:moving-average linestrategyLong-term investors might buy on a significantthe lower band.
Price-based indicators are technical indicators that use the price of an asset to generate signals or insights about its future direction. These indicators can be useful for traders and investors who want to identify trends, potential reversals, and other market movements.
Some common price-based indicators include:
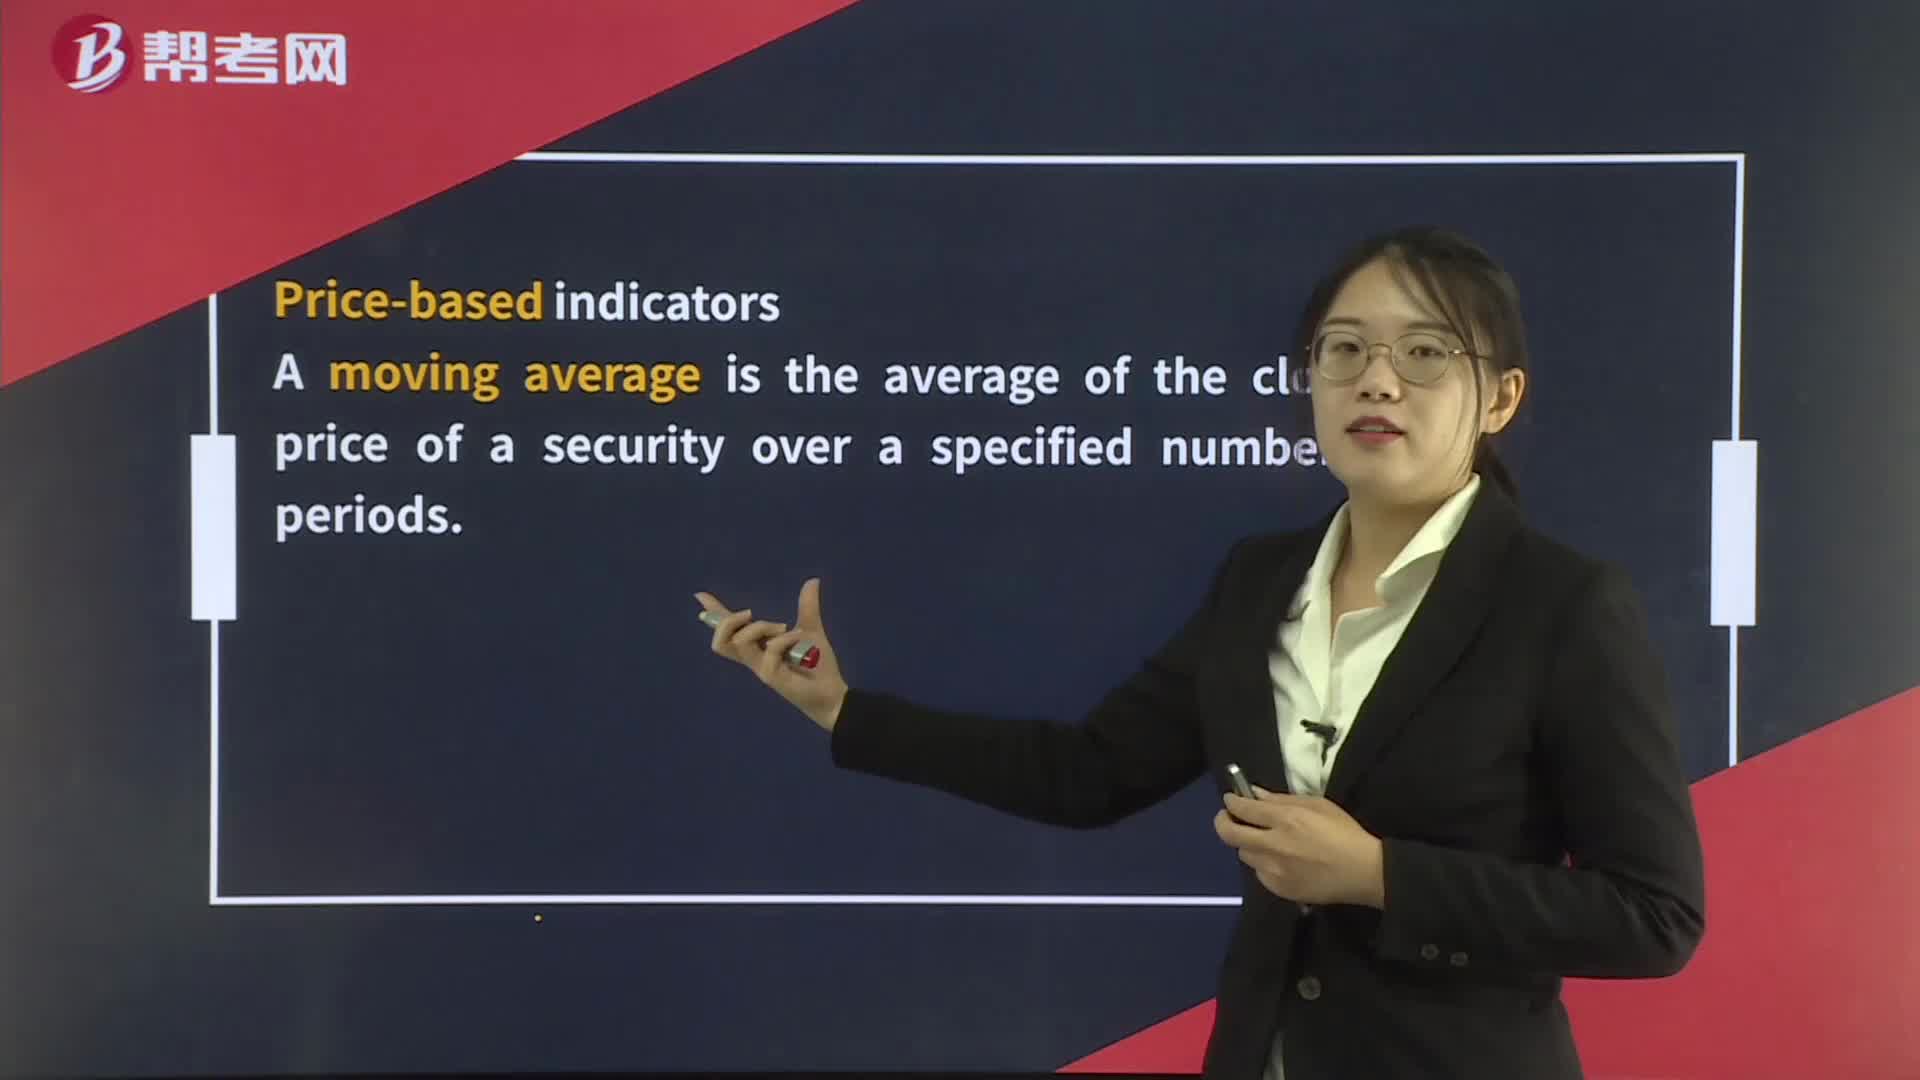
1. Moving Averages: Moving averages are one of the most widely used price-based indicators. They are calculated by averaging the price of an asset over a specific time period. Traders often use moving averages to identify the direction of the trend and potential support and resistance levels.
2. Bollinger Bands: Bollinger Bands are a type of price-based indicator that uses a moving average and two standard deviations to create a channel around the price of an asset. Traders use Bollinger Bands to identify potential breakouts or reversals.
3. Relative Strength Index (RSI): The RSI is a momentum-based indicator that compares the magnitude of recent gains to recent losses in an attempt to determine overbought and oversold conditions. Traders use the RSI to identify potential trend reversals.
4. Stochastic Oscillator: The stochastic oscillator is a momentum-based indicator that compares the closing price of an asset to its price range over a specific time period. Traders use the stochastic oscillator to identify potential trend reversals and overbought and oversold conditions.
5. Moving Average Convergence Divergence (MACD): The MACD is a trend-following momentum indicator that uses two moving averages to generate signals. Traders use the MACD to identify potential trend reversals and momentum shifts.
Overall, price-based indicators can be powerful tools for traders and investors who want to identify potential market movements. However, it's important to remember that no indicator is perfect, and traders should always use multiple indicators and other forms of analysis to make informed trading decisions.
Some common price-based indicators include:
1. Moving Averages: Moving averages are one of the most widely used price-based indicators. They are calculated by averaging the price of an asset over a specific time period. Traders often use moving averages to identify the direction of the trend and potential support and resistance levels.
2. Bollinger Bands: Bollinger Bands are a type of price-based indicator that uses a moving average and two standard deviations to create a channel around the price of an asset. Traders use Bollinger Bands to identify potential breakouts or reversals.
3. Relative Strength Index (RSI): The RSI is a momentum-based indicator that compares the magnitude of recent gains to recent losses in an attempt to determine overbought and oversold conditions. Traders use the RSI to identify potential trend reversals.
4. Stochastic Oscillator: The stochastic oscillator is a momentum-based indicator that compares the closing price of an asset to its price range over a specific time period. Traders use the stochastic oscillator to identify potential trend reversals and overbought and oversold conditions.
5. Moving Average Convergence Divergence (MACD): The MACD is a trend-following momentum indicator that uses two moving averages to generate signals. Traders use the MACD to identify potential trend reversals and momentum shifts.
Overall, price-based indicators can be powerful tools for traders and investors who want to identify potential market movements. However, it's important to remember that no indicator is perfect, and traders should always use multiple indicators and other forms of analysis to make informed trading decisions.
CFA考试视频Technical Indicators— Price-based IndicatorsCFA一级视频