Technical Analysis Tools— Chart Patterns Summary
316 播放时长:155
加载播放器...
B.,[PracticeB.C.€125.Target= €100 + €100 − €75 = €125
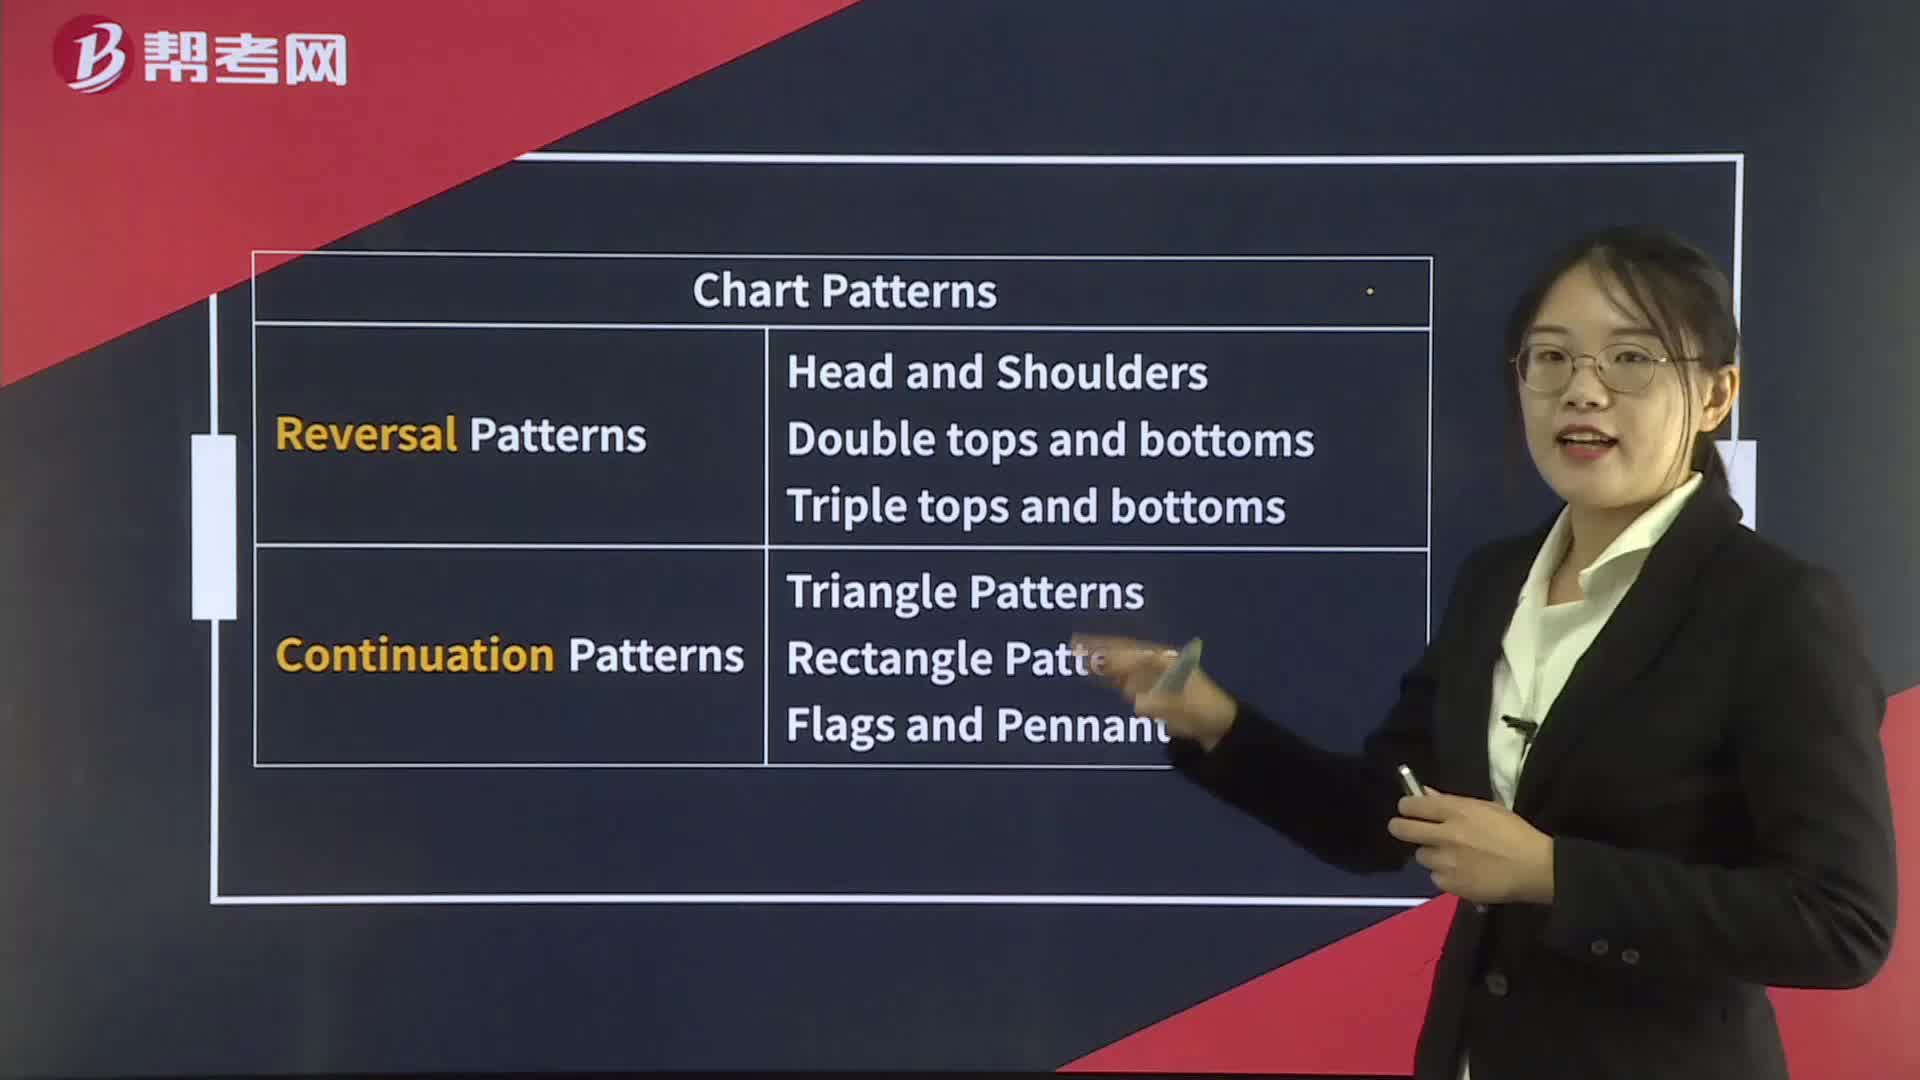
Technical analysis tools such as chart patterns are used by traders to identify potential trend reversals or continuation in the price of an asset. Some of the most common chart patterns include:
1. Head and Shoulders: This pattern is formed when the price of an asset rises to a peak (left shoulder), falls, rises again to a higher peak (head), falls again, and then rises to a lower peak (right shoulder). This pattern is considered a bearish reversal signal.
2. Double Top/Bottom: This pattern is formed when the price of an asset rises to a peak (double top) or falls to a low (double bottom), then falls or rises respectively. This pattern is considered a bearish or bullish reversal signal.
3. Triangle: This pattern is formed when the price of an asset moves in a series of higher lows and lower highs, forming a triangle. The breakout from this pattern can be either bullish or bearish, depending on the direction of the breakout.
4. Rectangle: This pattern is formed when the price of an asset moves in a range between two horizontal lines. The breakout from this pattern can be either bullish or bearish, depending on the direction of the breakout.
5. Cup and Handle: This pattern is formed when the price of an asset rises to a peak, falls, and then rises again to form a rounded bottom (cup), followed by a small dip (handle). This pattern is considered a bullish continuation signal.
Traders use these chart patterns in conjunction with other technical analysis tools to make trading decisions. It is important to note that chart patterns are not always accurate and should be used in combination with other indicators and analysis techniques.
CFA考试视频Technical Analysis Tools— Chart Patterns SummaryCFA一级视频