-

下载亿题库APP
-
联系电话:400-660-1360
下载亿题库APP
联系电话:400-660-1360

请谨慎保管和记忆你的密码,以免泄露和丢失
请谨慎保管和记忆你的密码,以免泄露和丢失
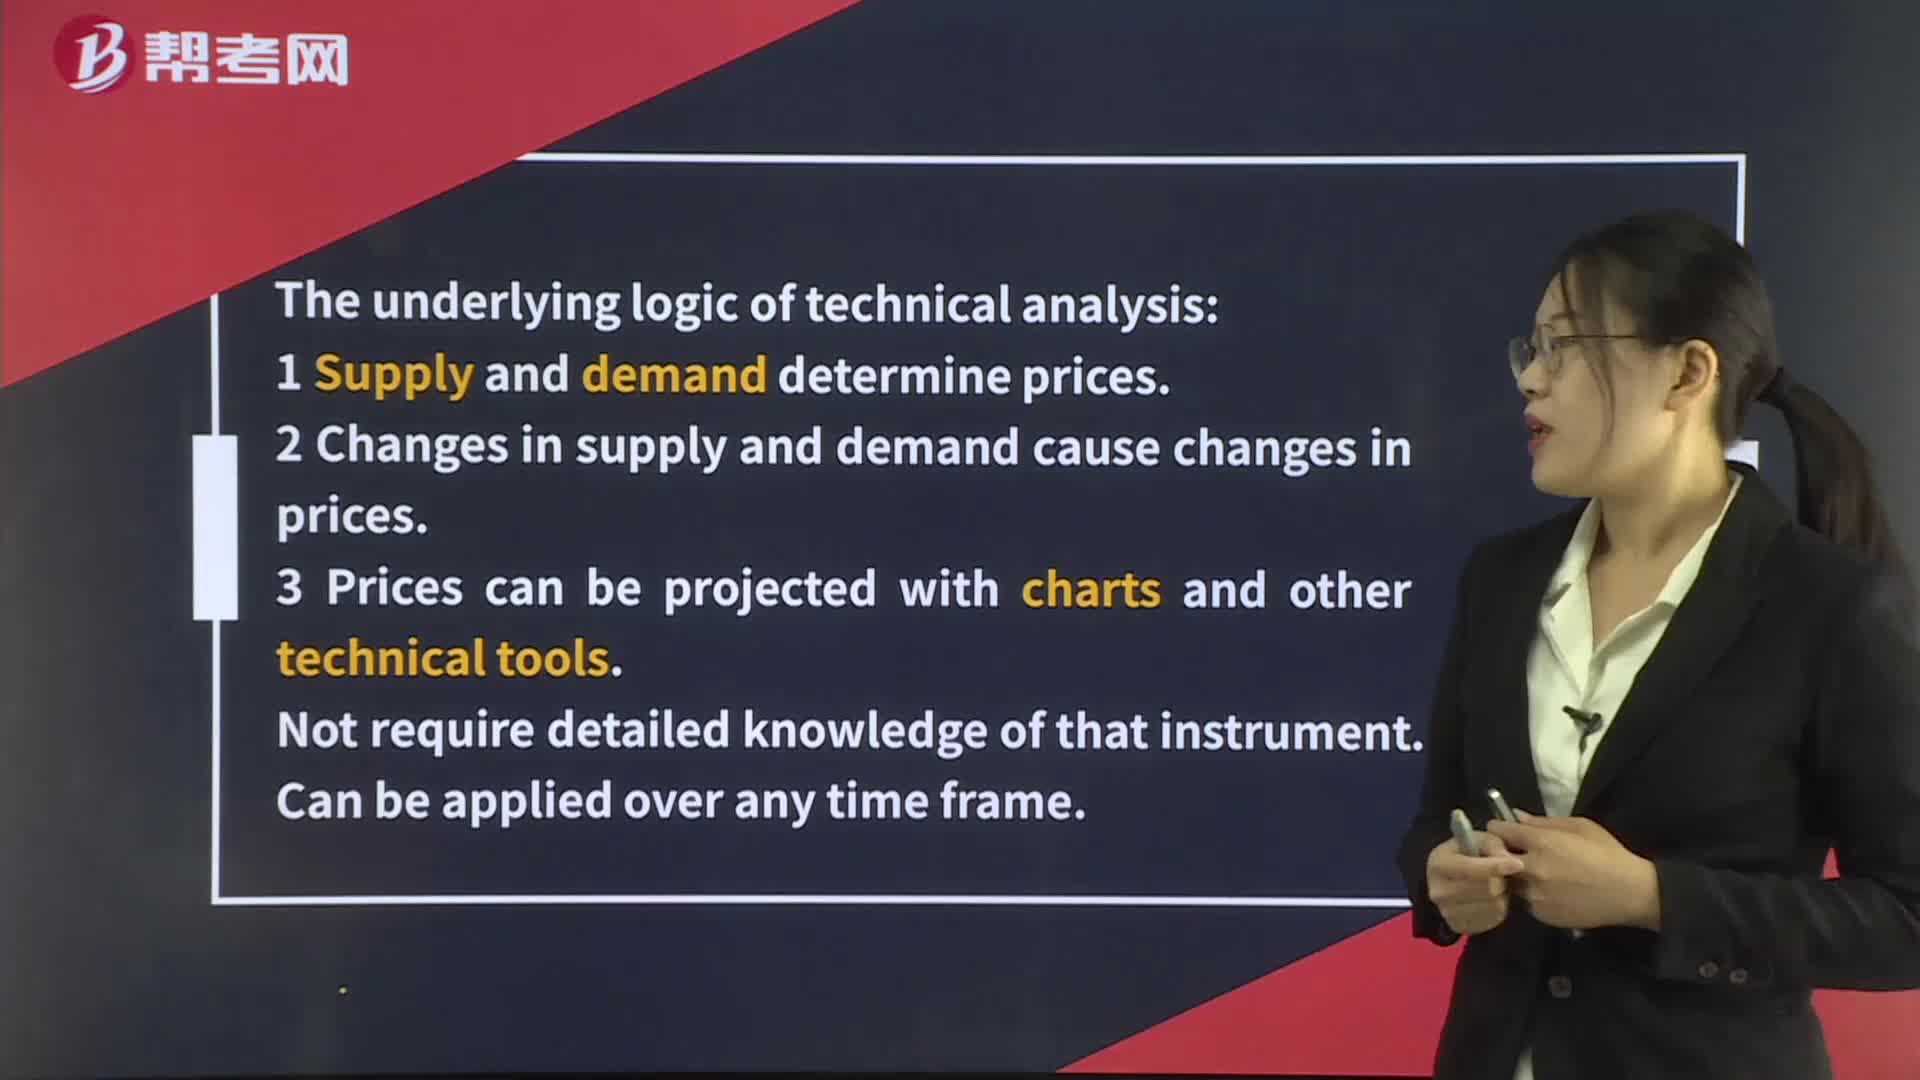
Technical Analysis
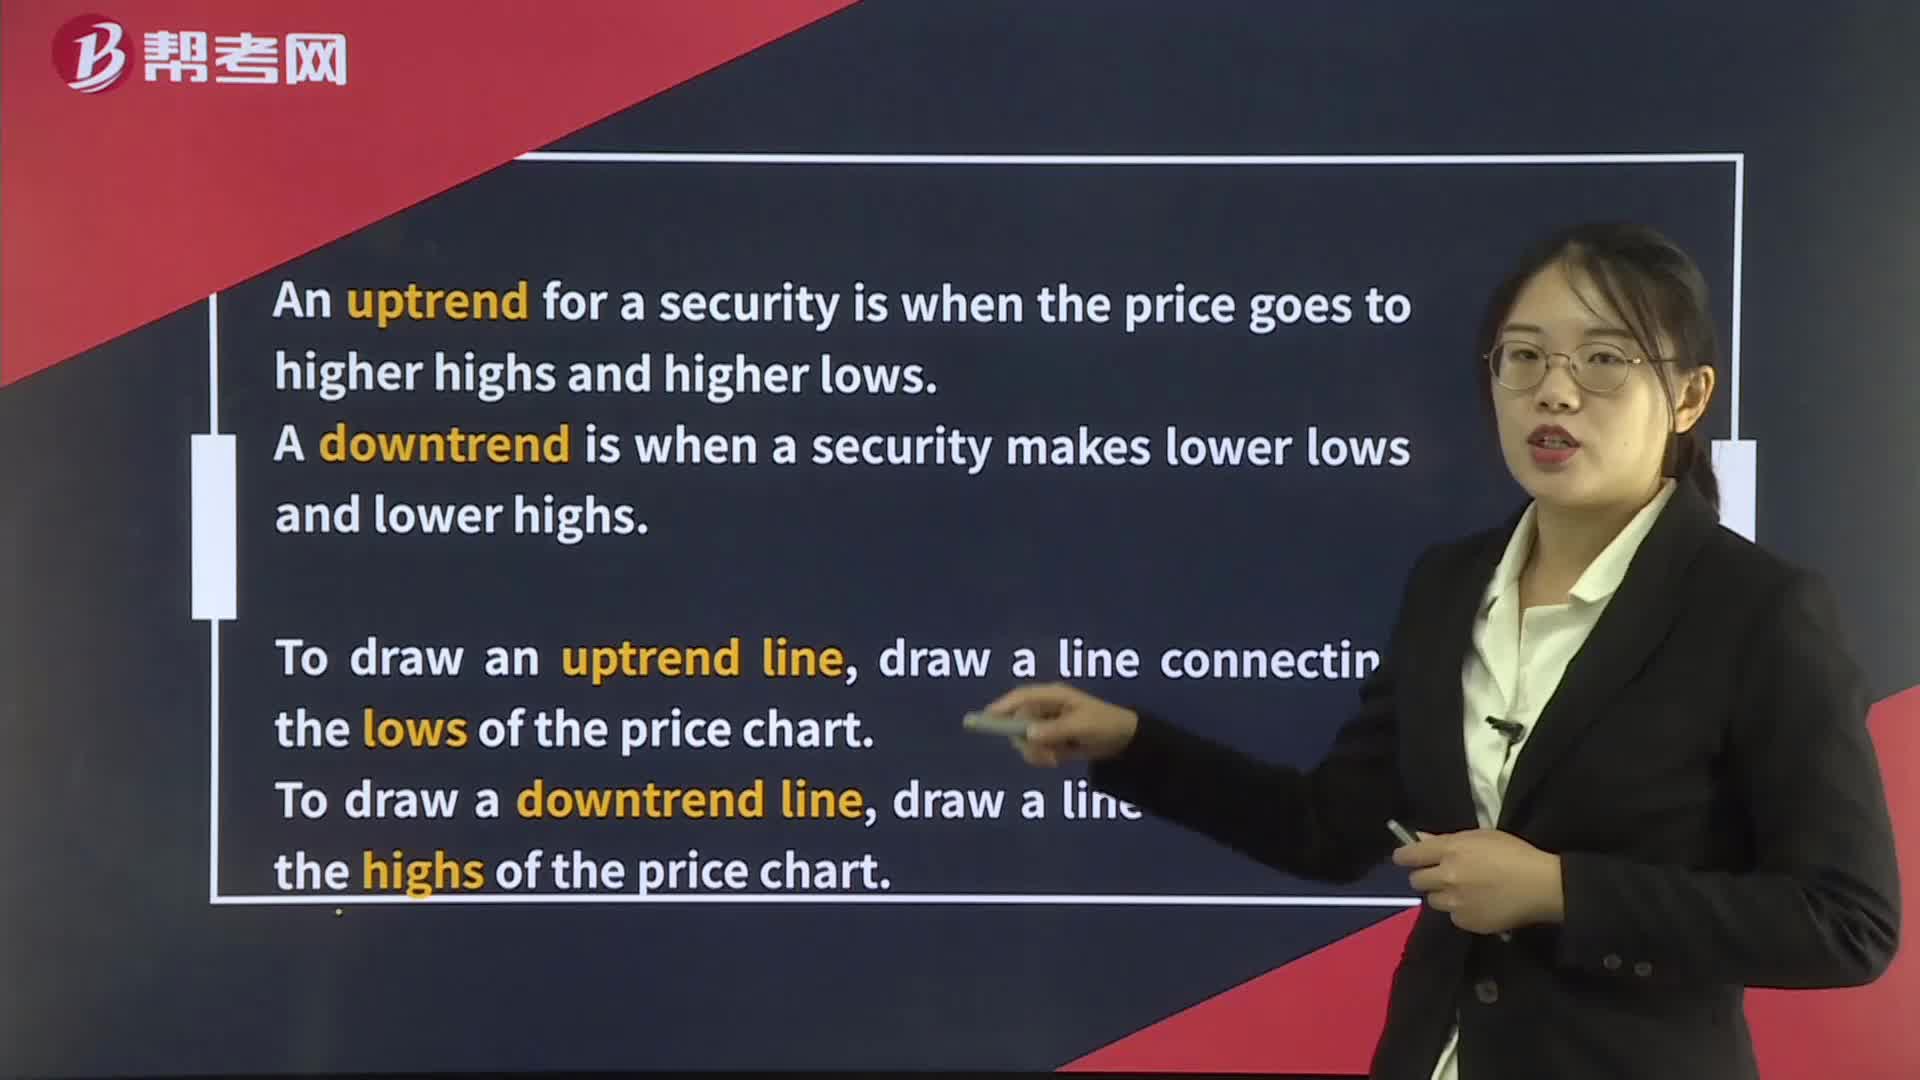
Technical Analysis Tools— Trend
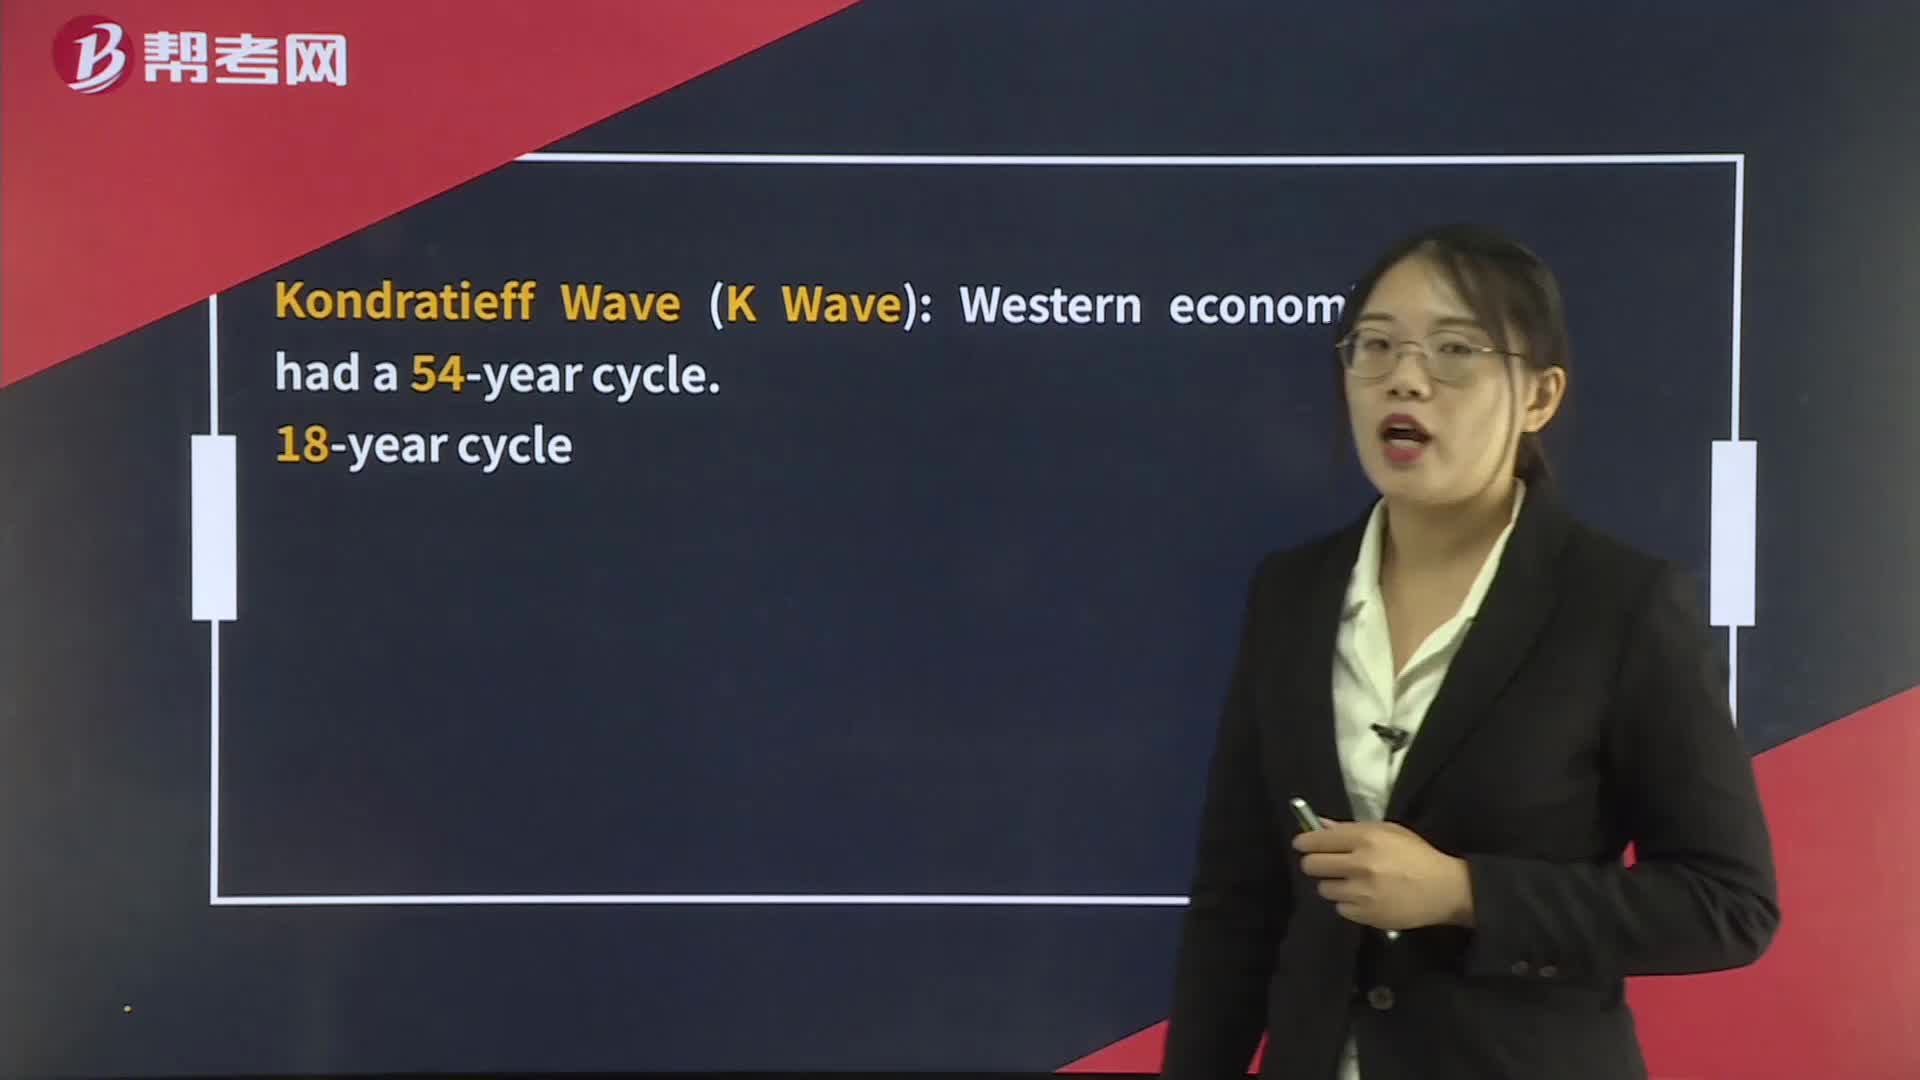
Technical Analysis Tools— Cycles
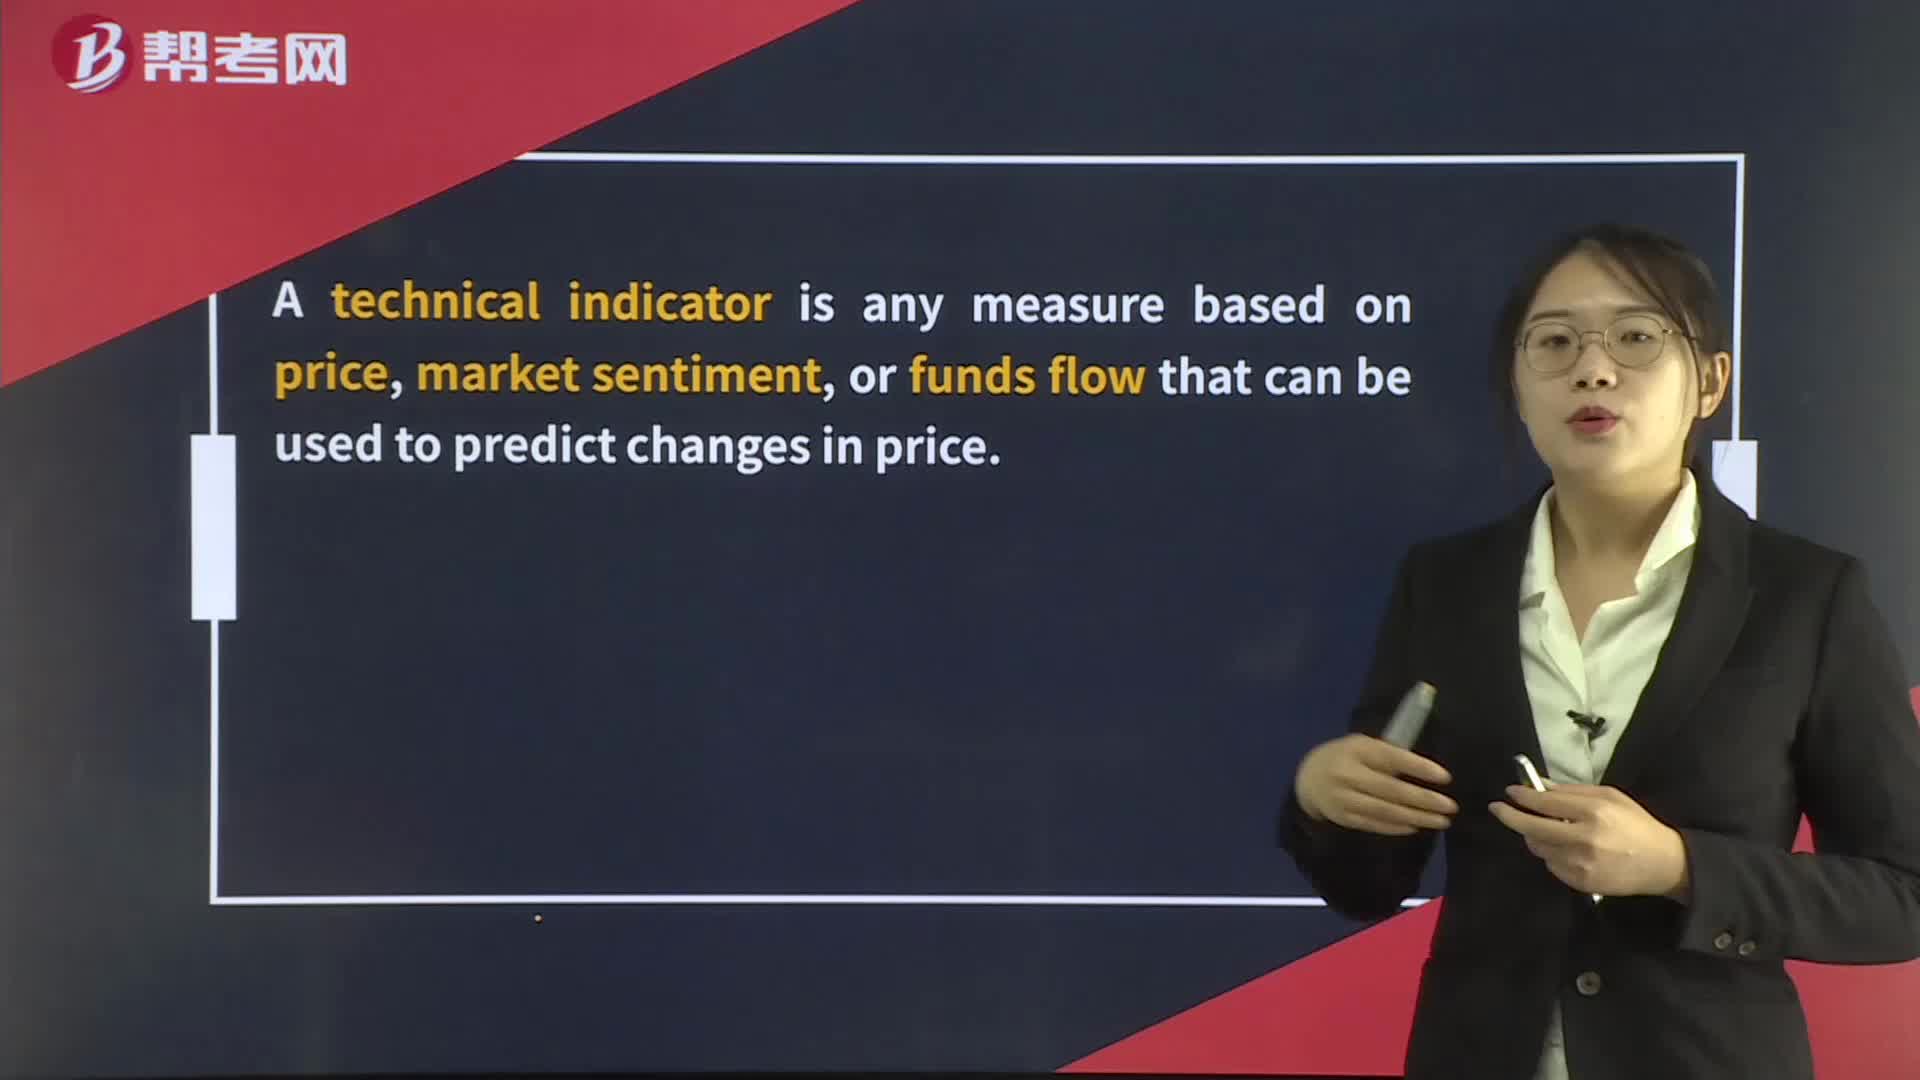
Technical Analysis Tools— Technical Indicators
Technical Analysis Tools— Reversal Patterns
Technical Analysis Tools— Continuation Patterns
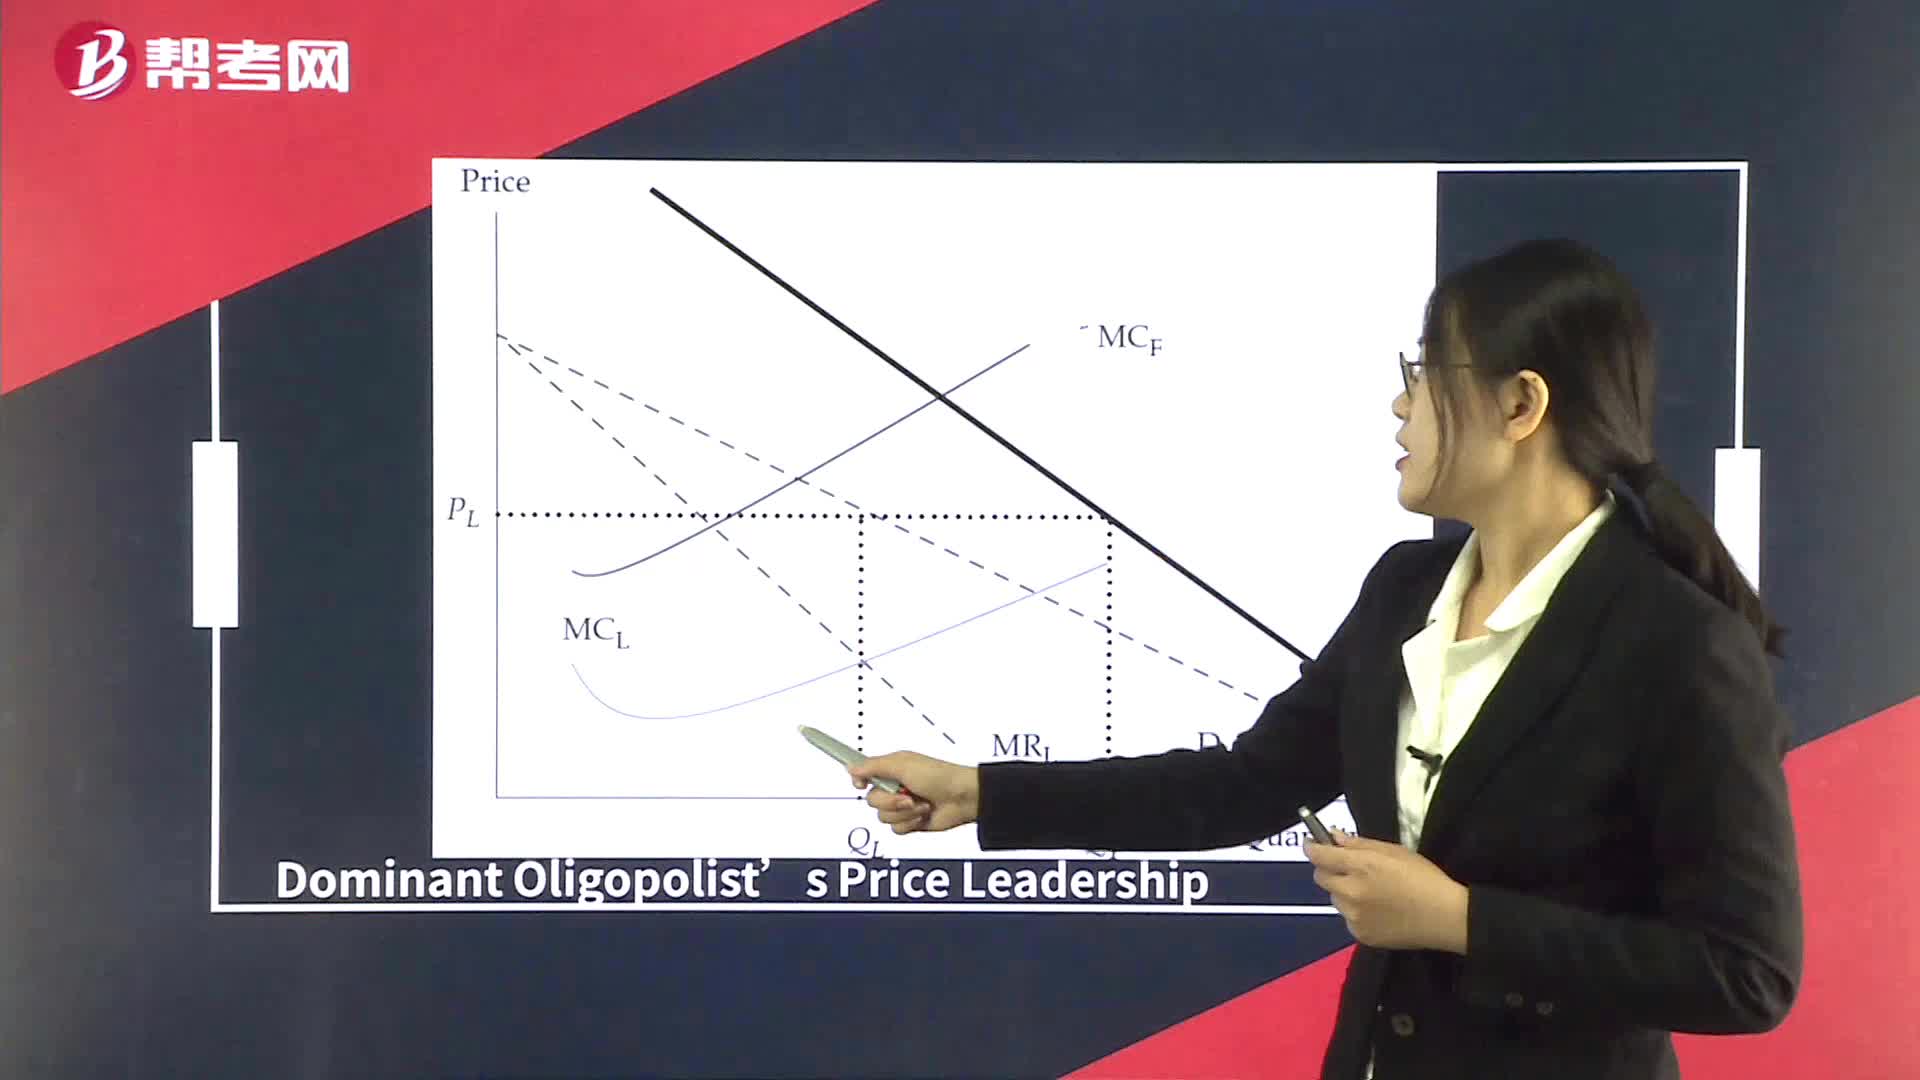
Supply Analysis in Oligopoly Market
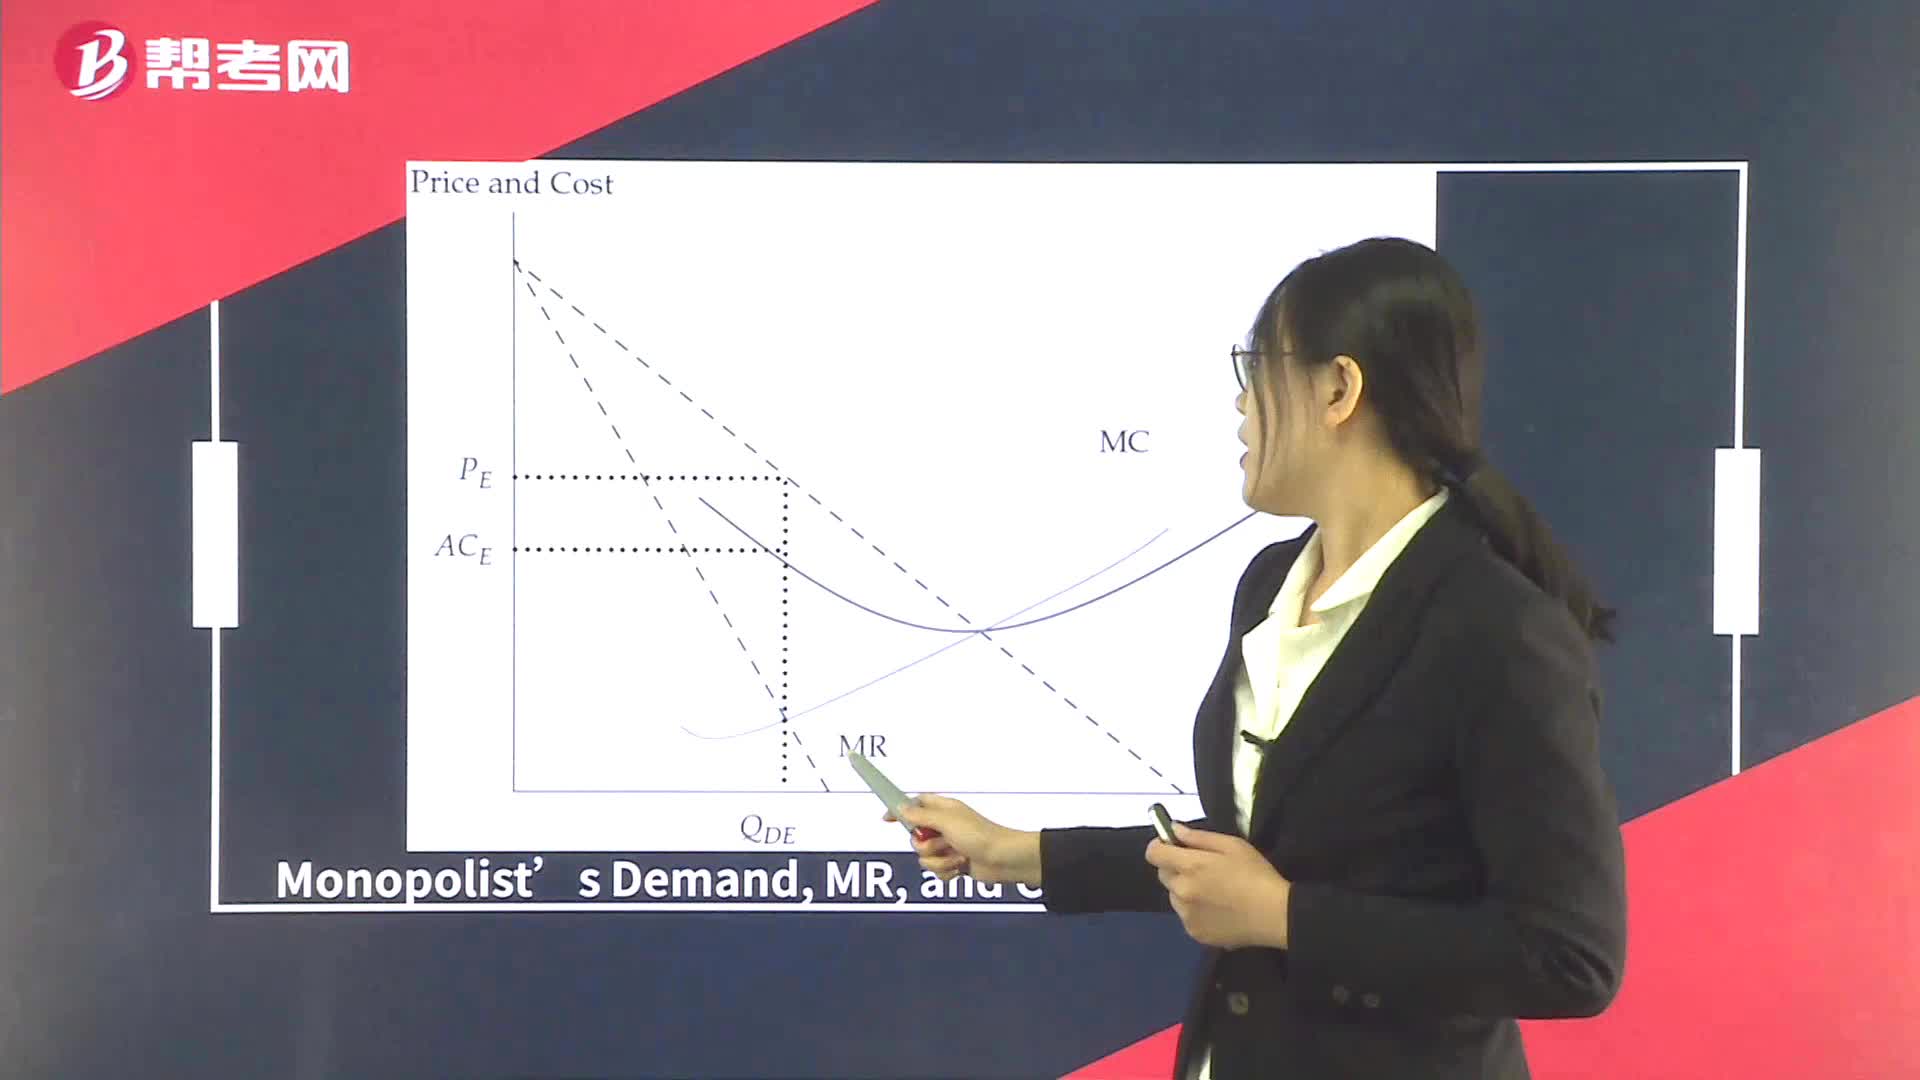
Supply Analysis in Monopoly
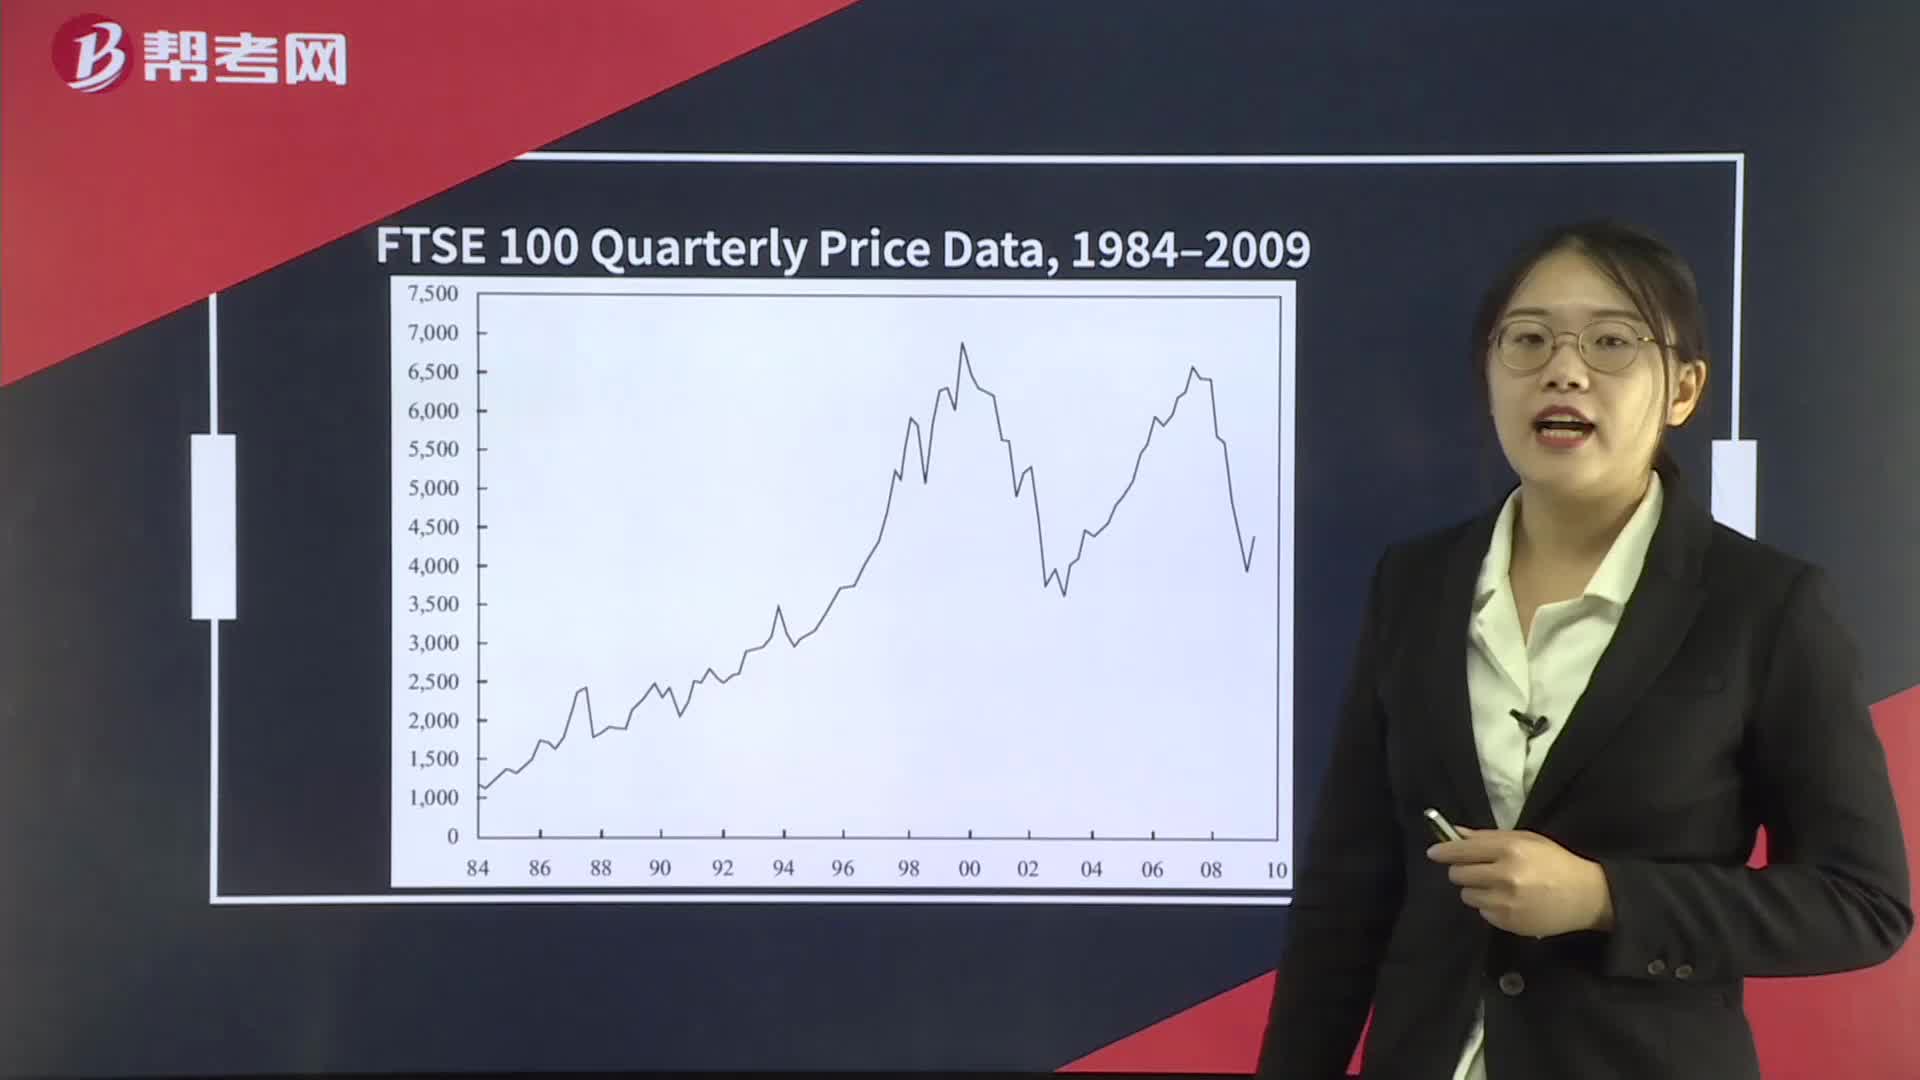
Technical Analysis Tools— Charts
Supply Analysis in Monopolistic Competition
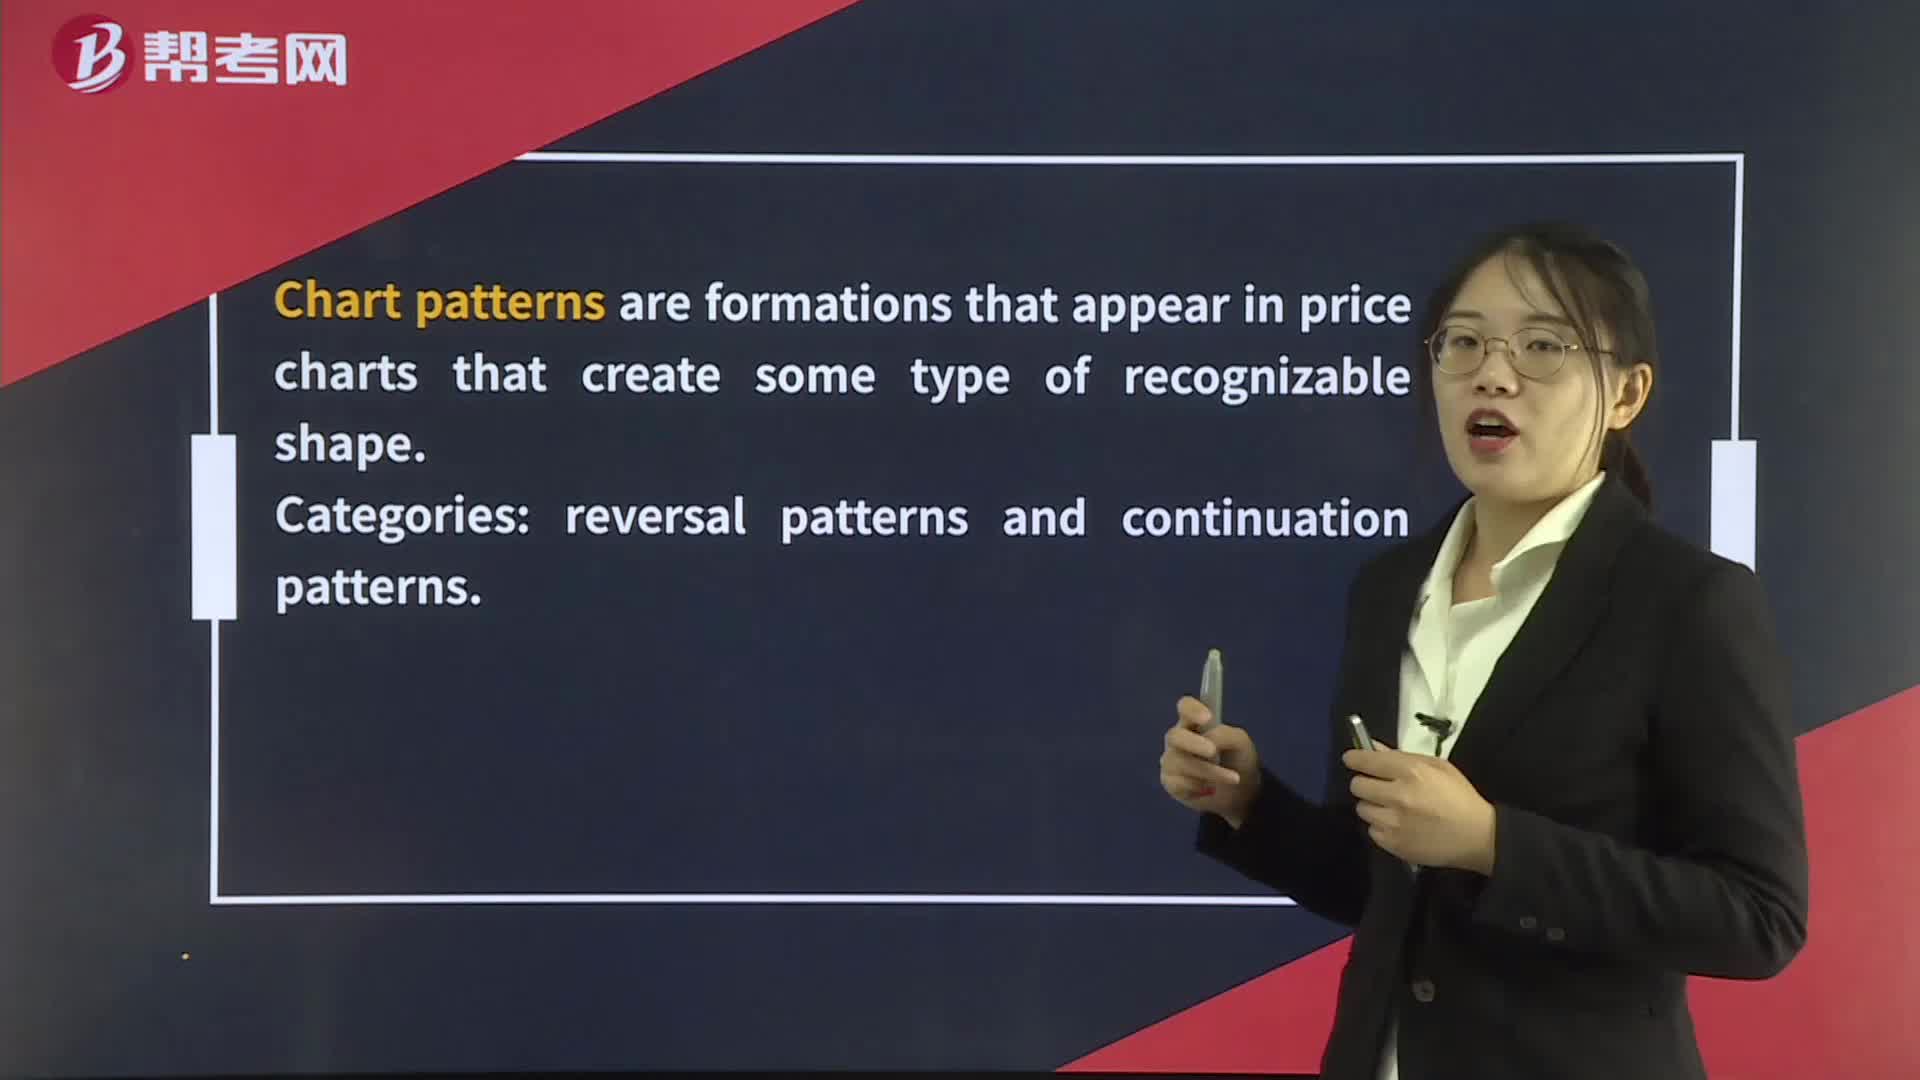
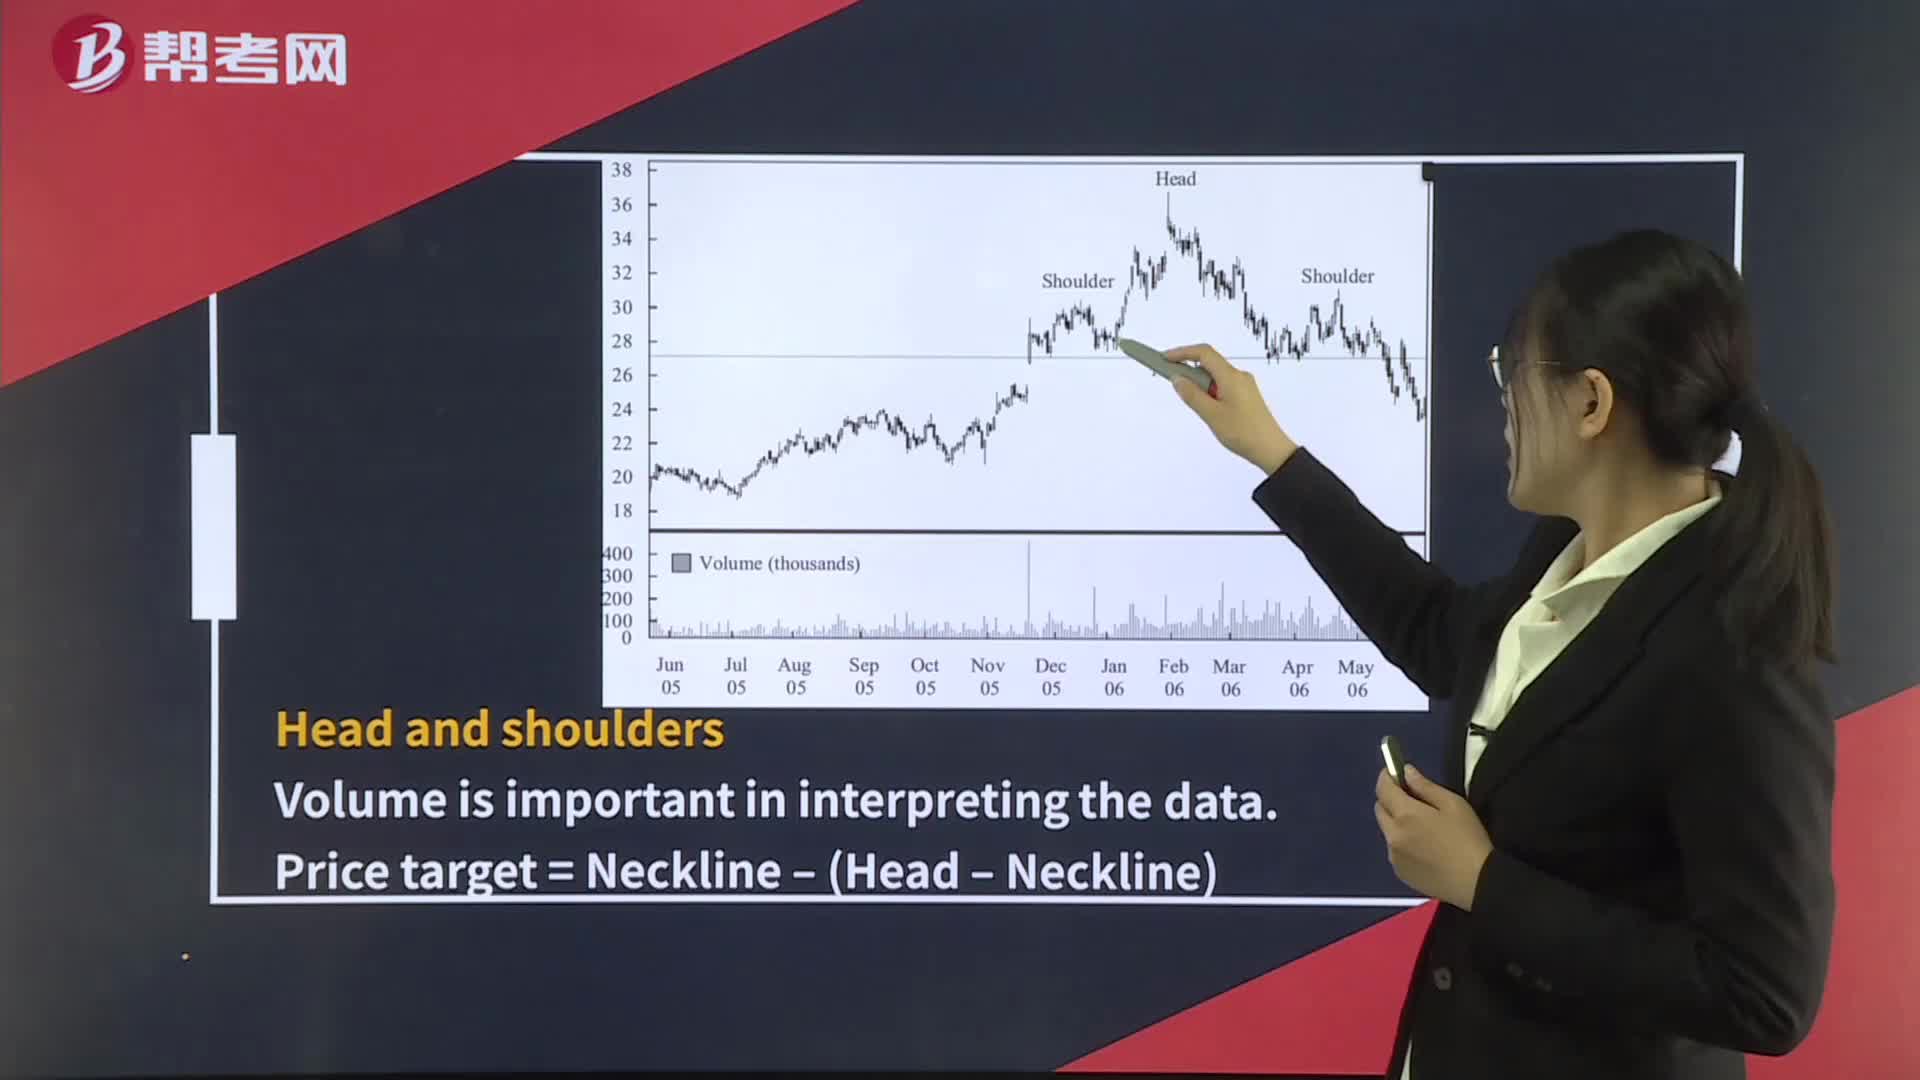
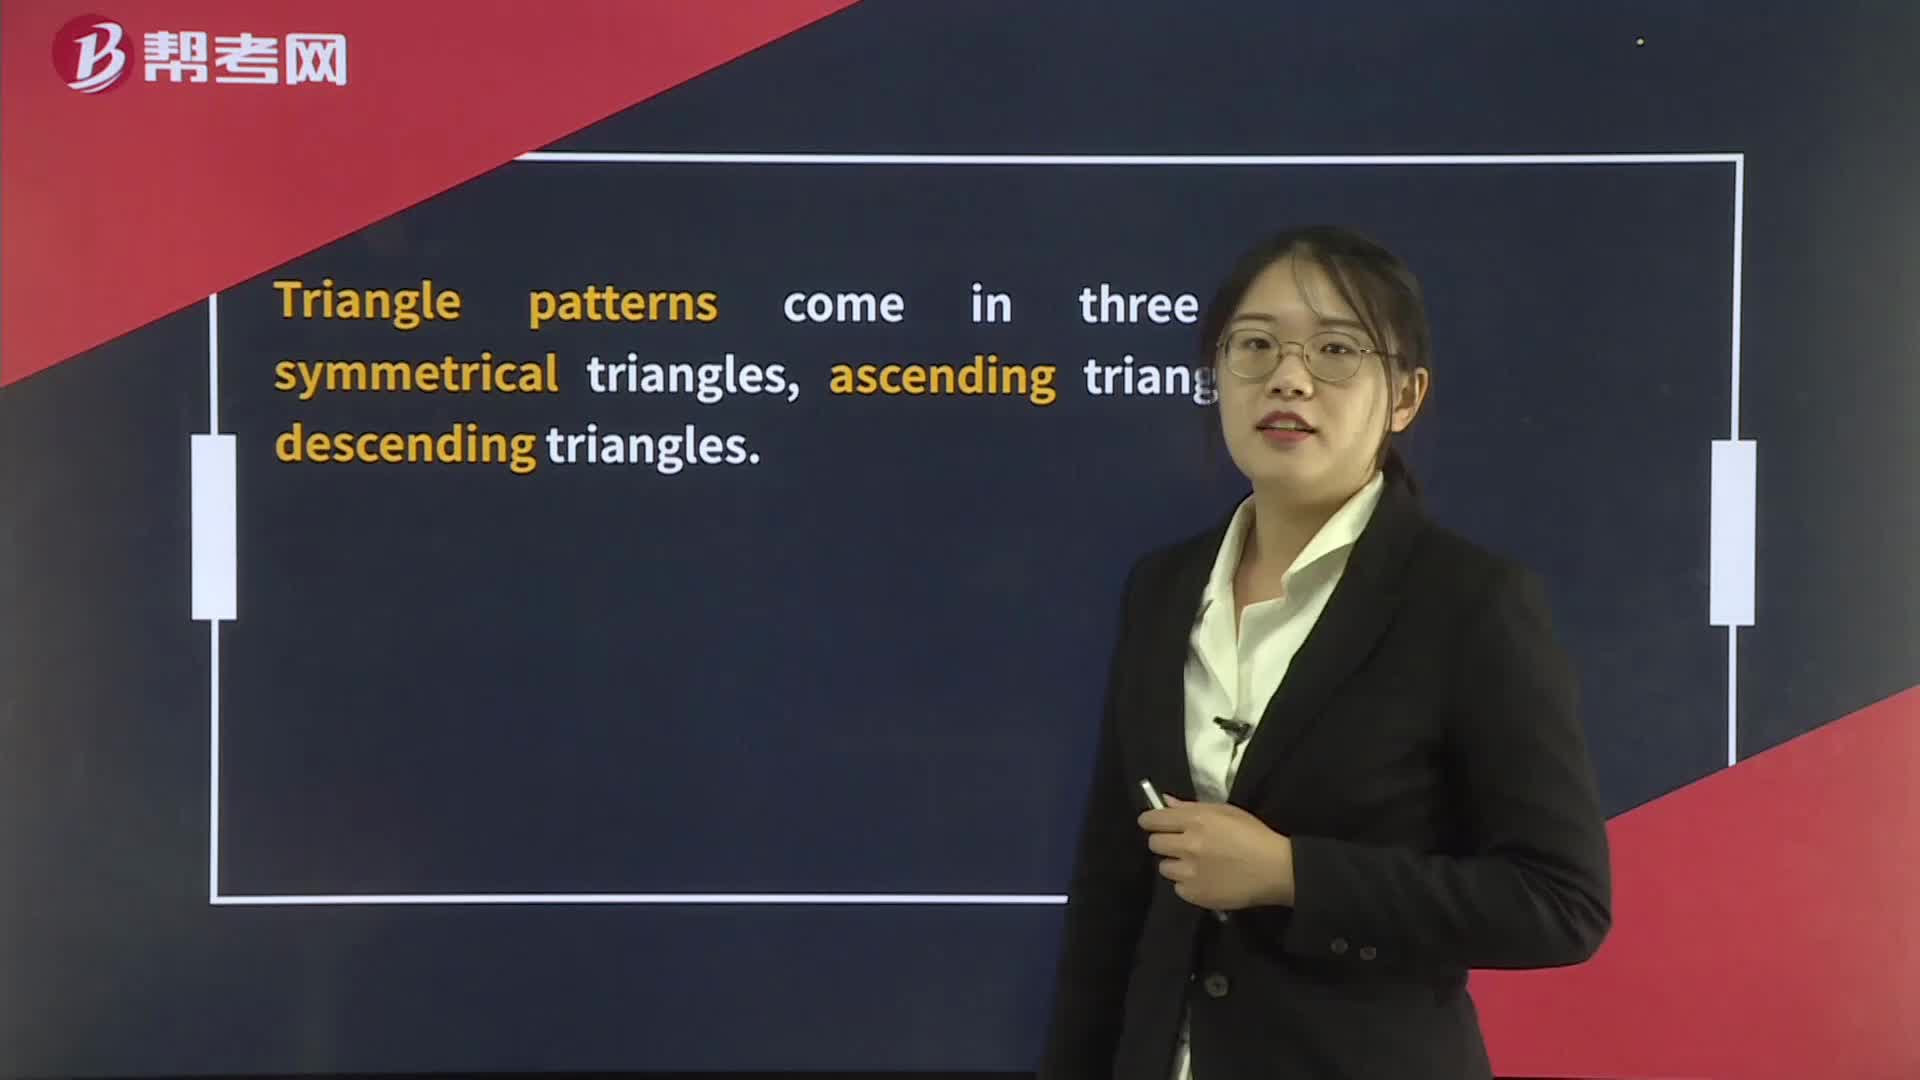
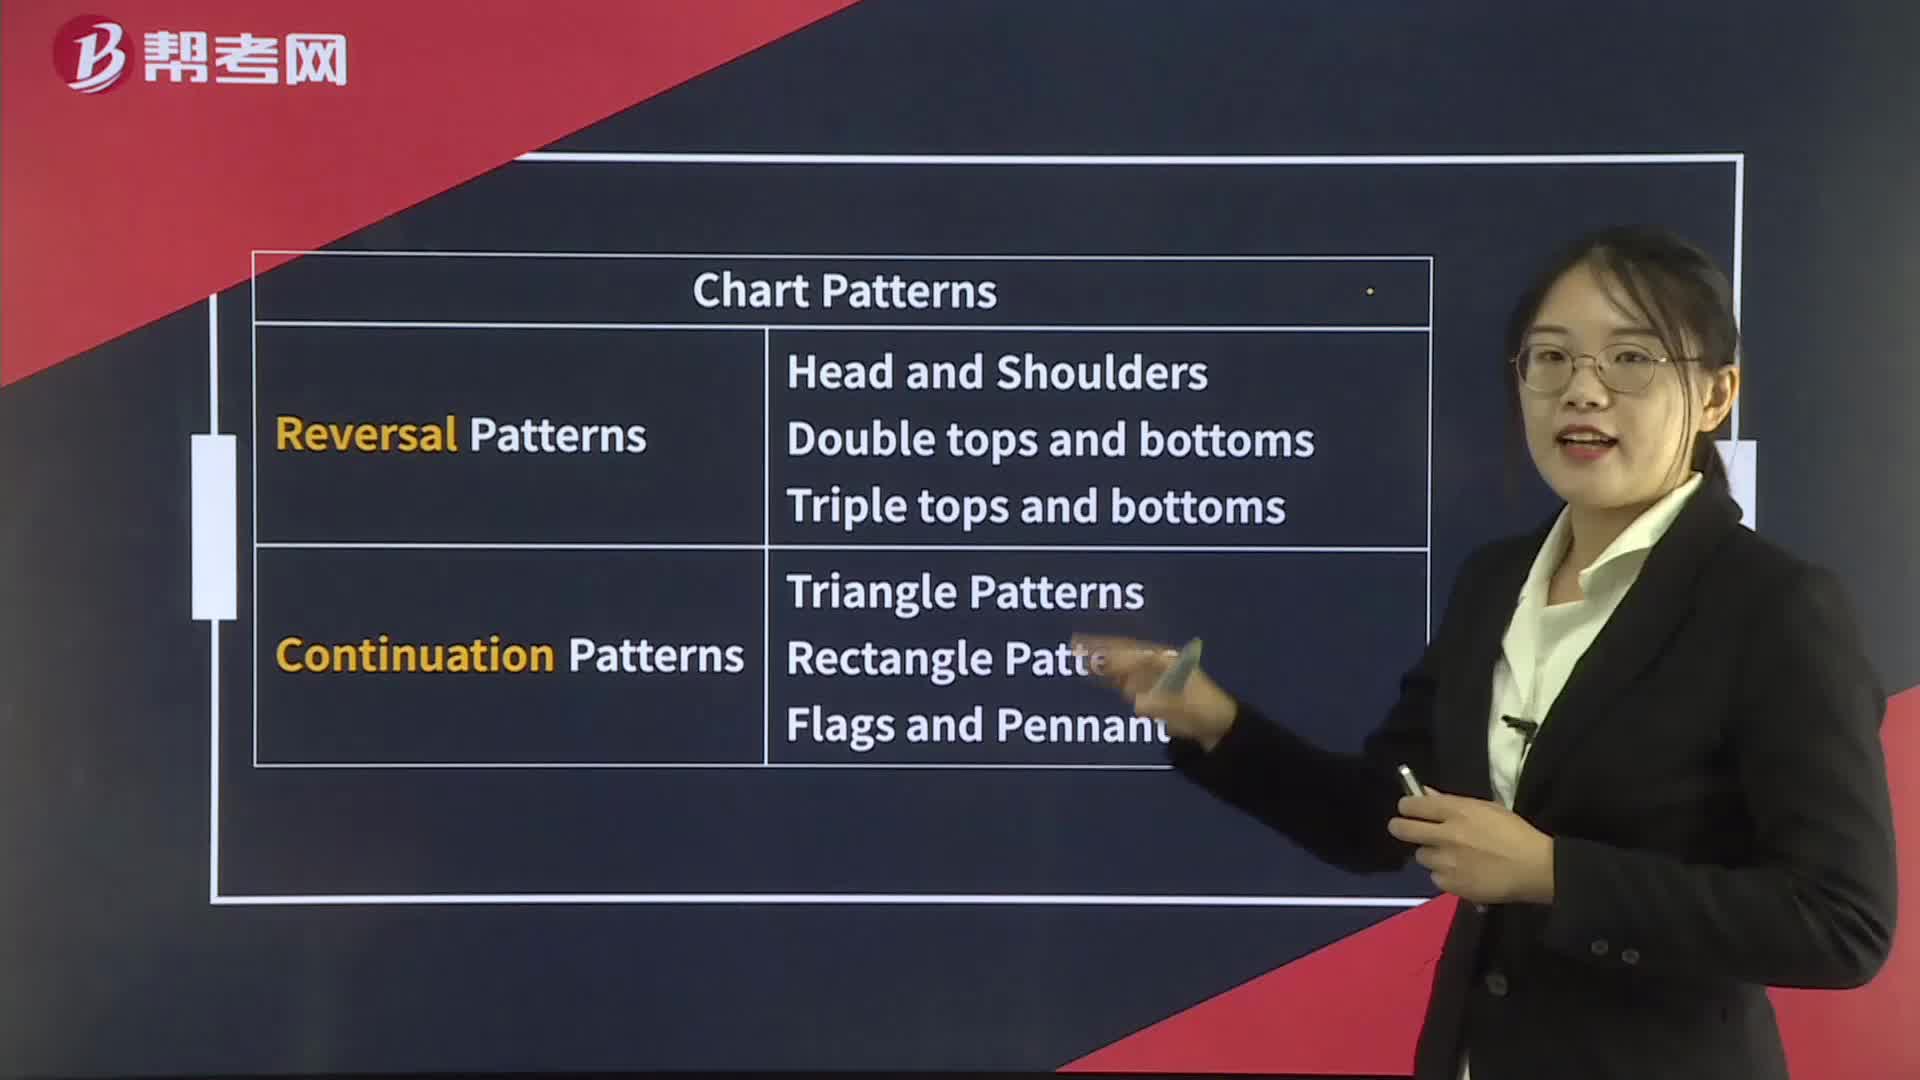
Technical Analysis Tools— Chart Patterns
Technical Analysis Tools— Chart Patterns Summary
 01:25
01:25
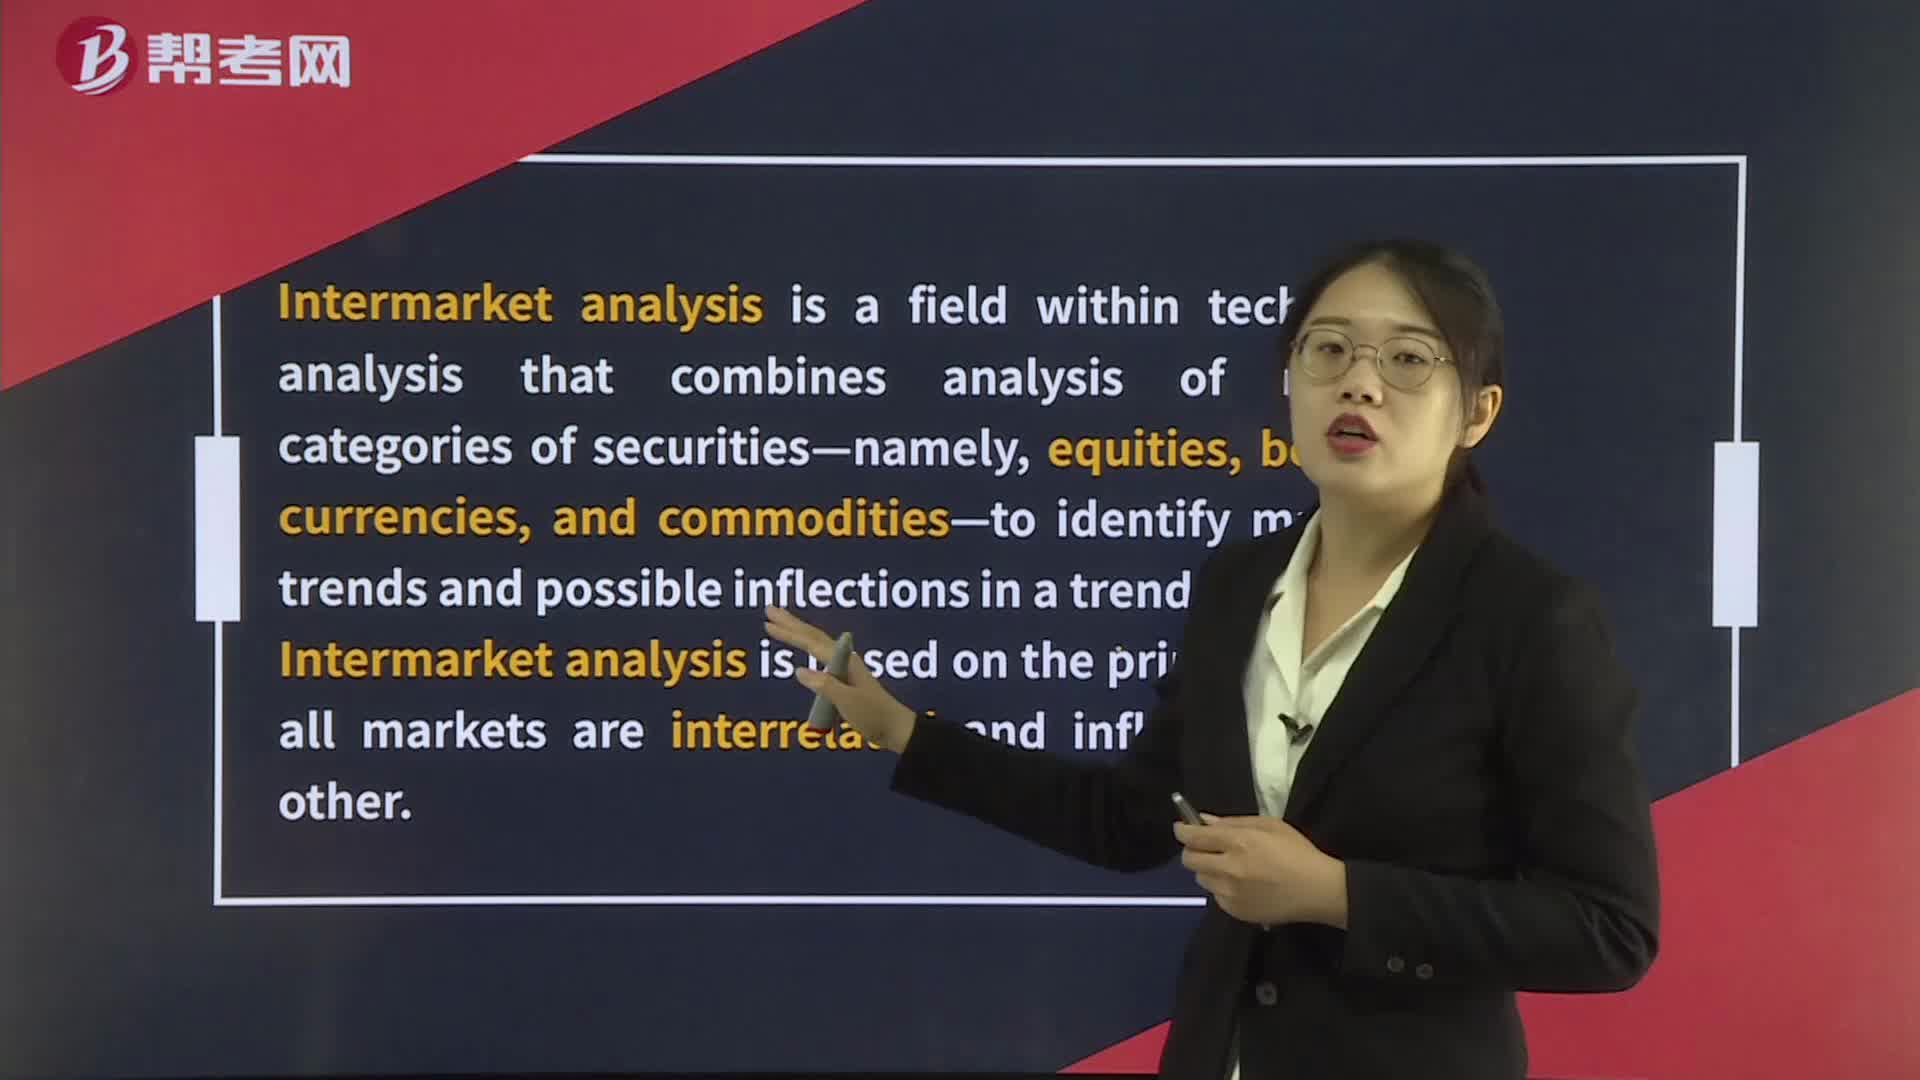
Intermarket analysis:analysisby the price of another.
 01:48
01:48
Scope of Financial Statement Analysis:creditorder to form expectations about its future performance and financial position.
 03:29
03:29
Breakeven Analysis:but not positive economic profit.
 30:10
30:10
Technical Analysis Tools— Technical Indicators:average is the average of the closing price of a security over a specified:Once price begins to move back up toward its moving-average linestrategyLong-term investors might buy on a significant
 02:02
02:02
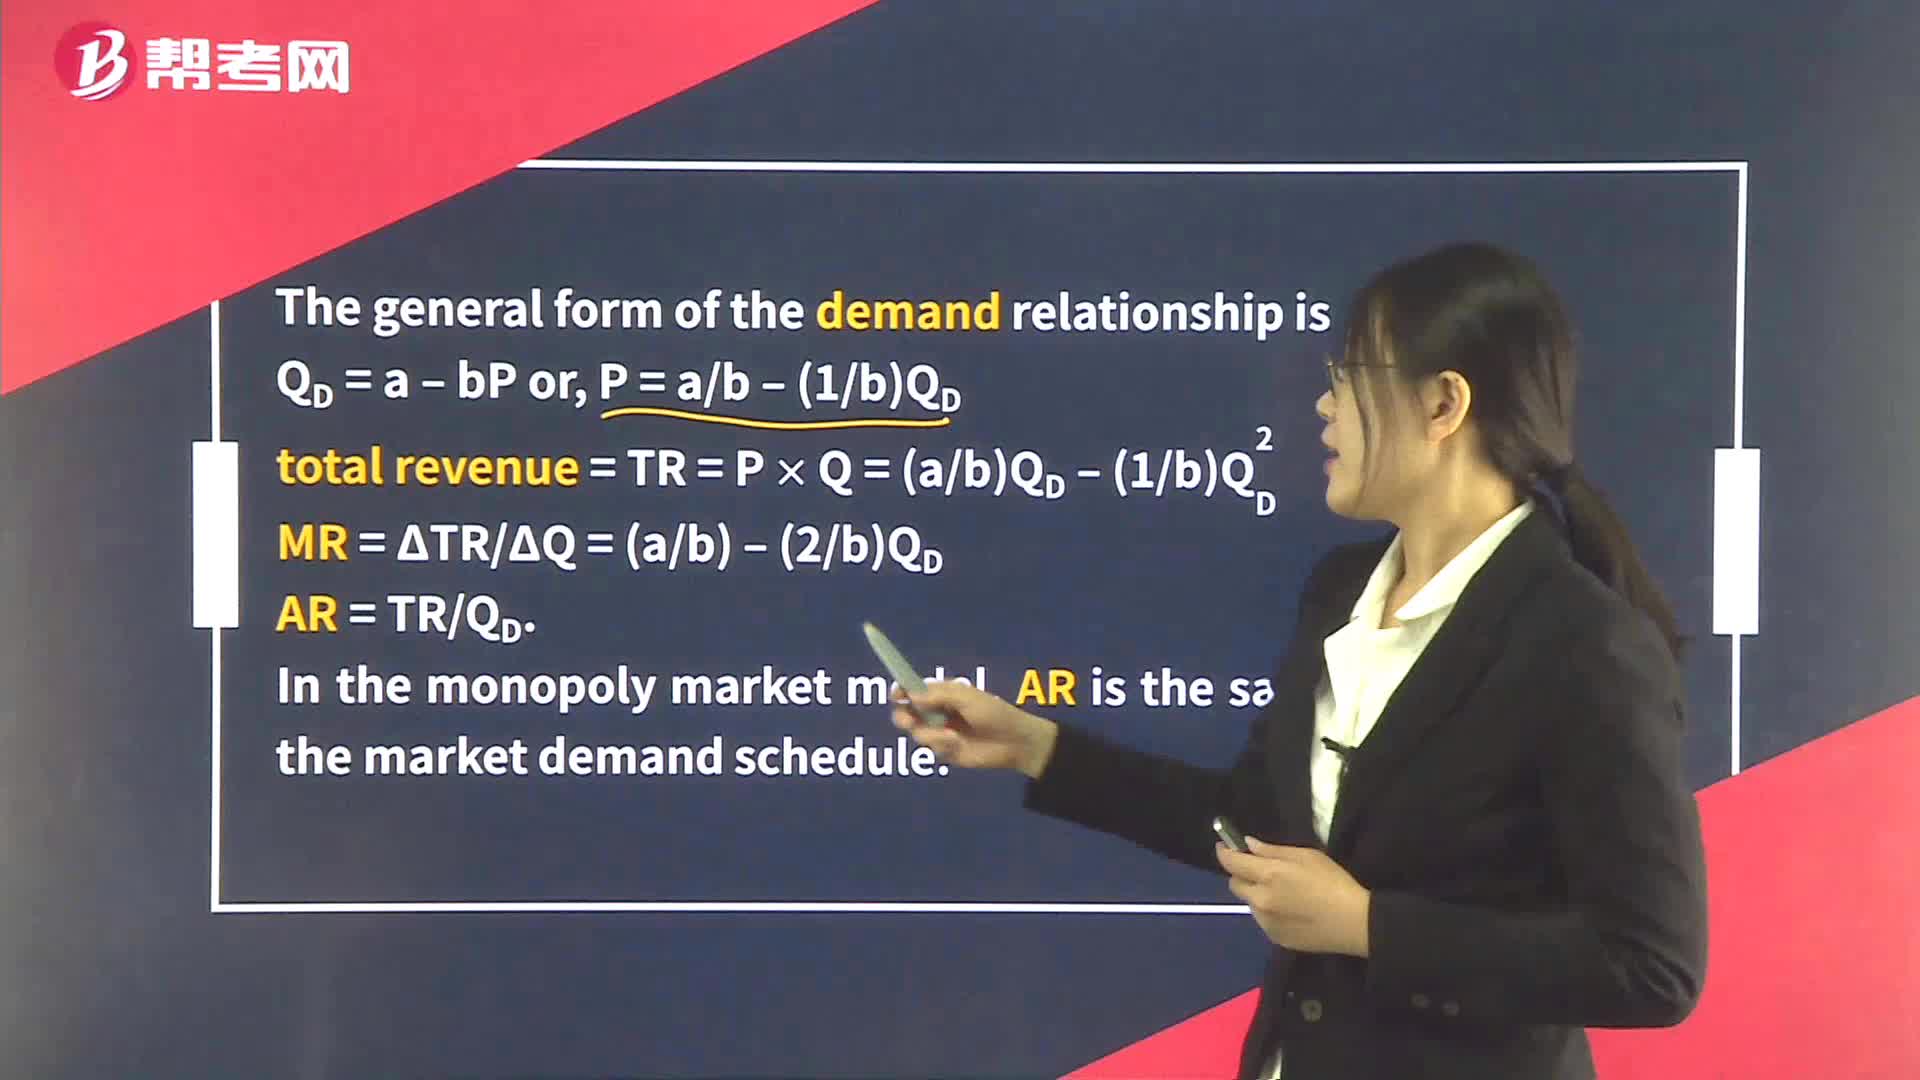
Demand Analysis in Monopoly:ARis the same as the market demand schedule.
 01:44
01:44
Intermarket analysis:analysisby the price of another.
 04:12
04:12
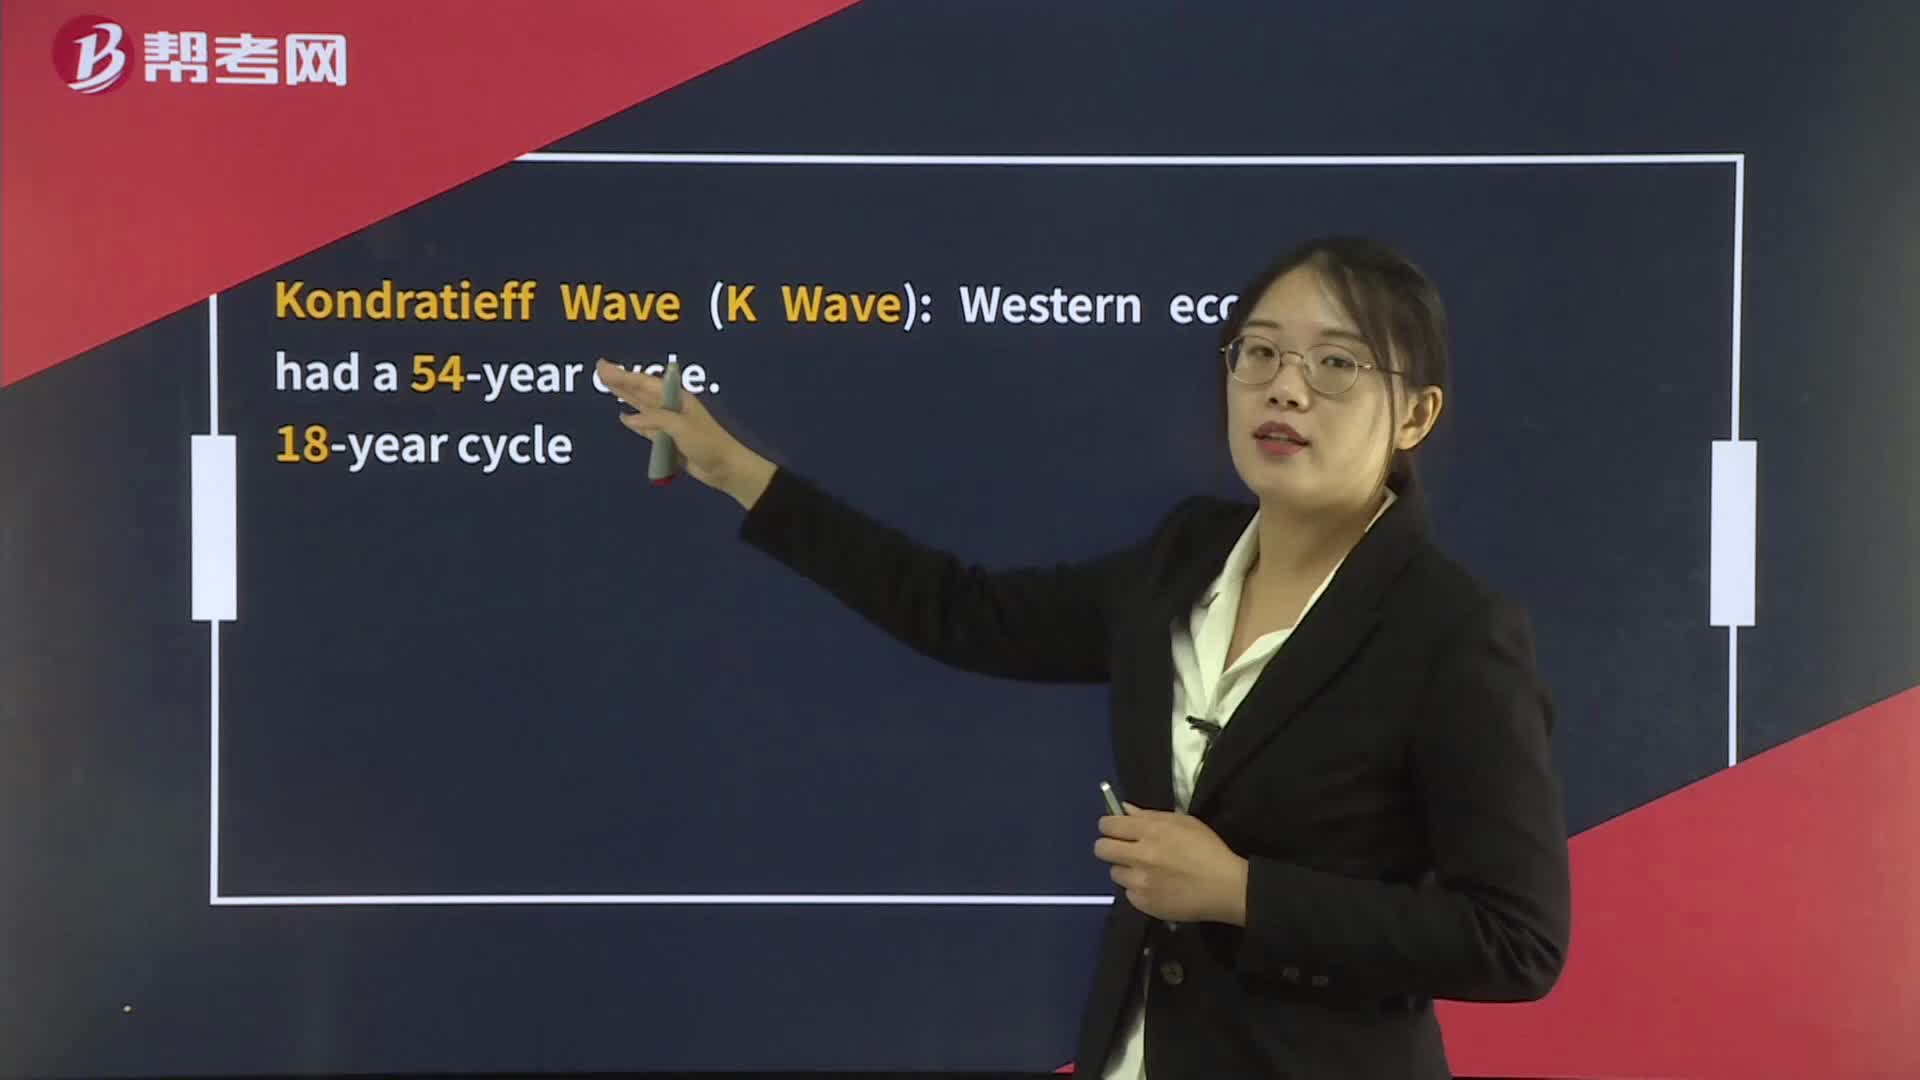
Technical Analysis Tools— Cycles:Kondratieff WaveK Wave:Post-election years and the midterm year have the worst performance.[Solutions]Aa zero will have the worst.
 08:54
08:54
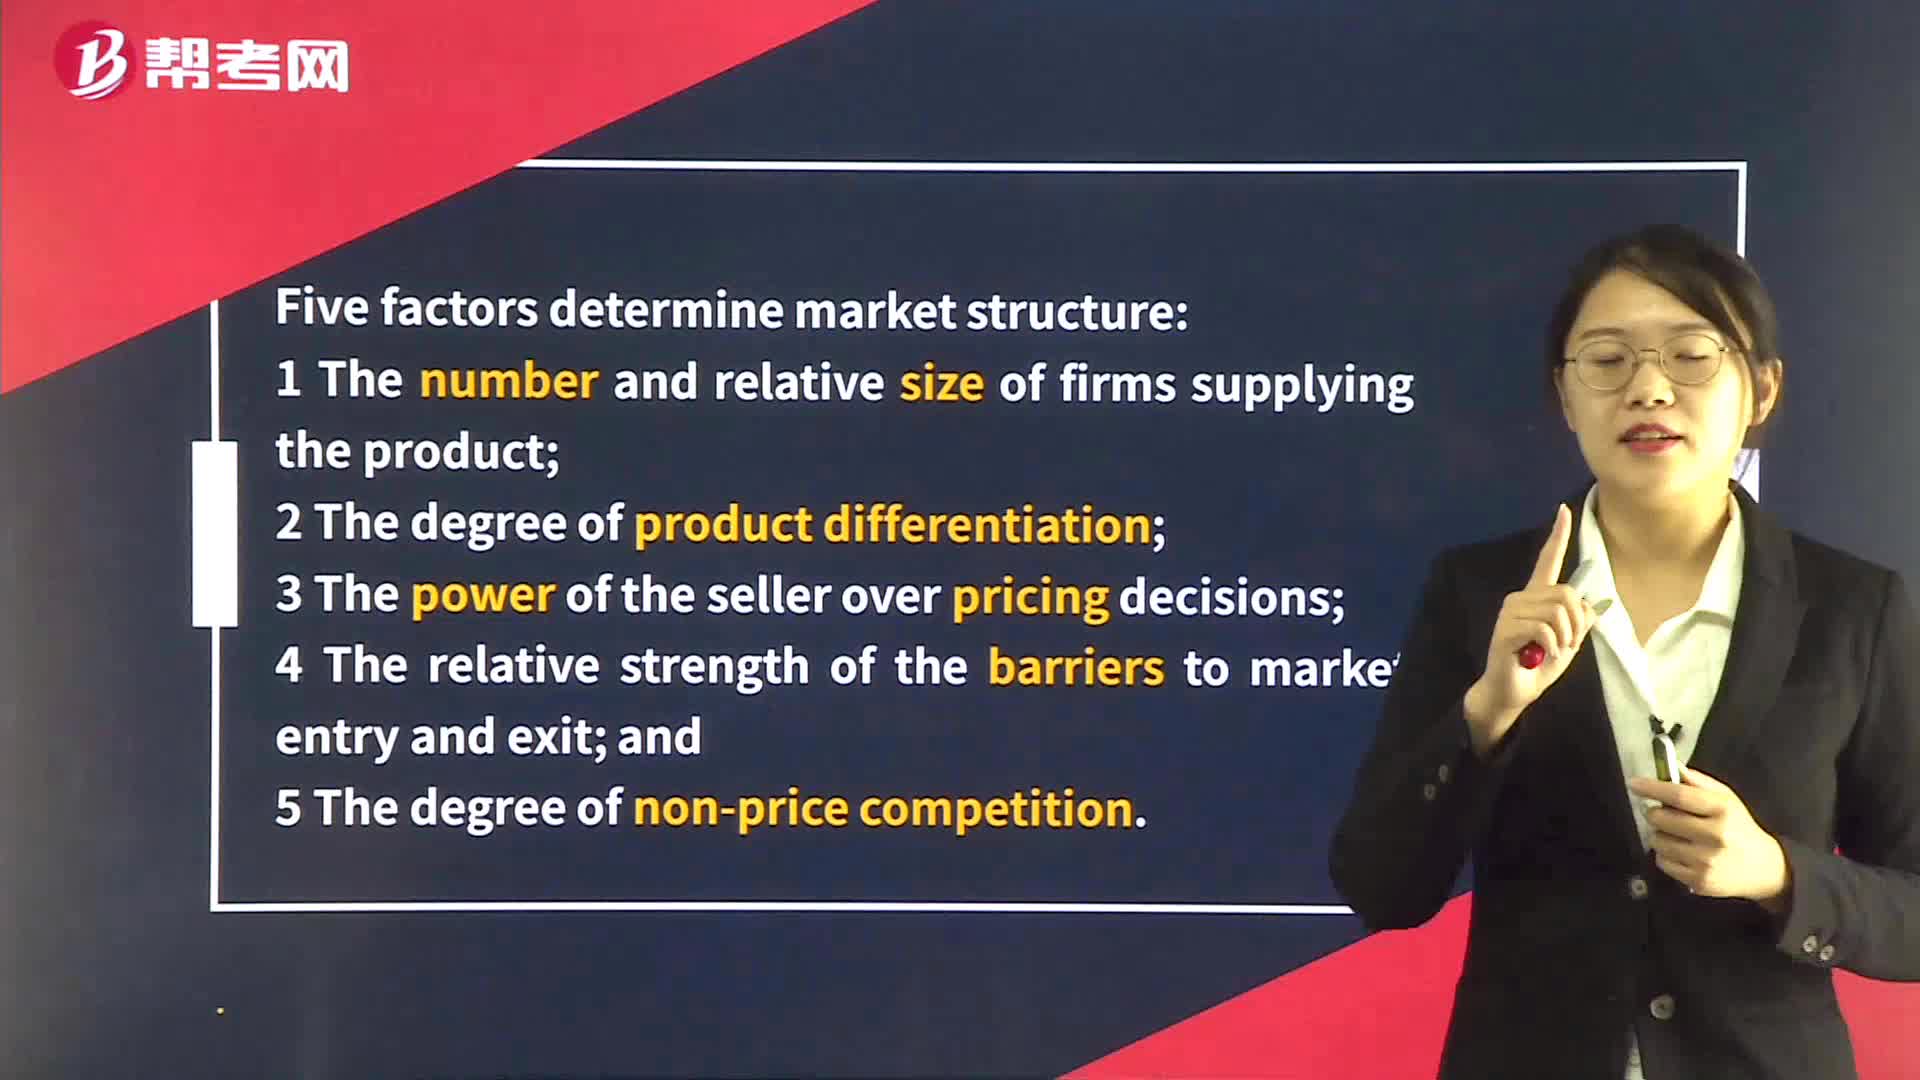
Analysis of Market Structure:2 The degree of product differentiation;4 The relative strength of the barriers to market entry and exit:monopoly.A[PracticeC.B
 15:59
15:59
Technical Analysis Tools— Chart Patterns:Chart,Categories,Double:tops:FlagsFlag[Practice
 04:14
04:14
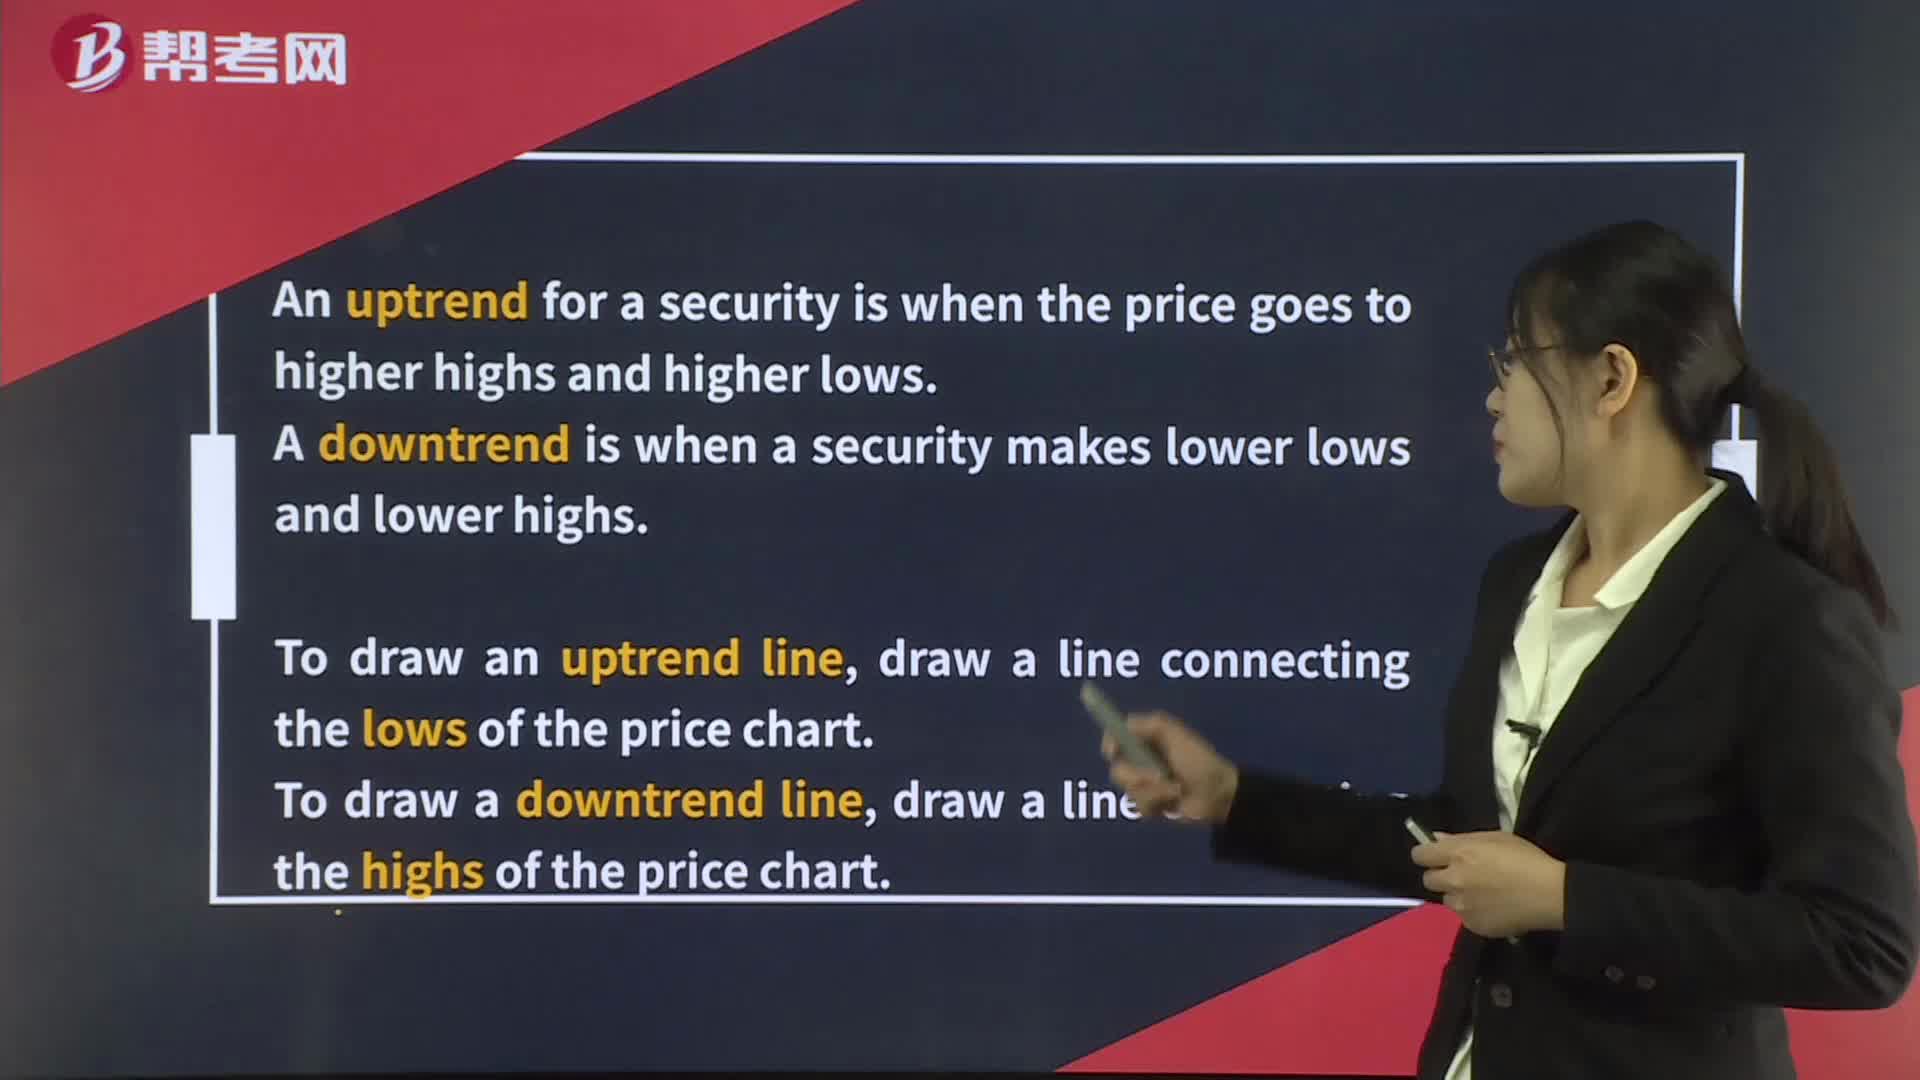
Technical Analysis Tools— Trend:line,draw a line connecting the highs of the price chart.:price.[PracticeLtd.price.Change
 10:09
10:09
Technical Analysis Tools— Charts:First,size.,Box,meaning.?scale[Practicemonth.
 11:31
11:31
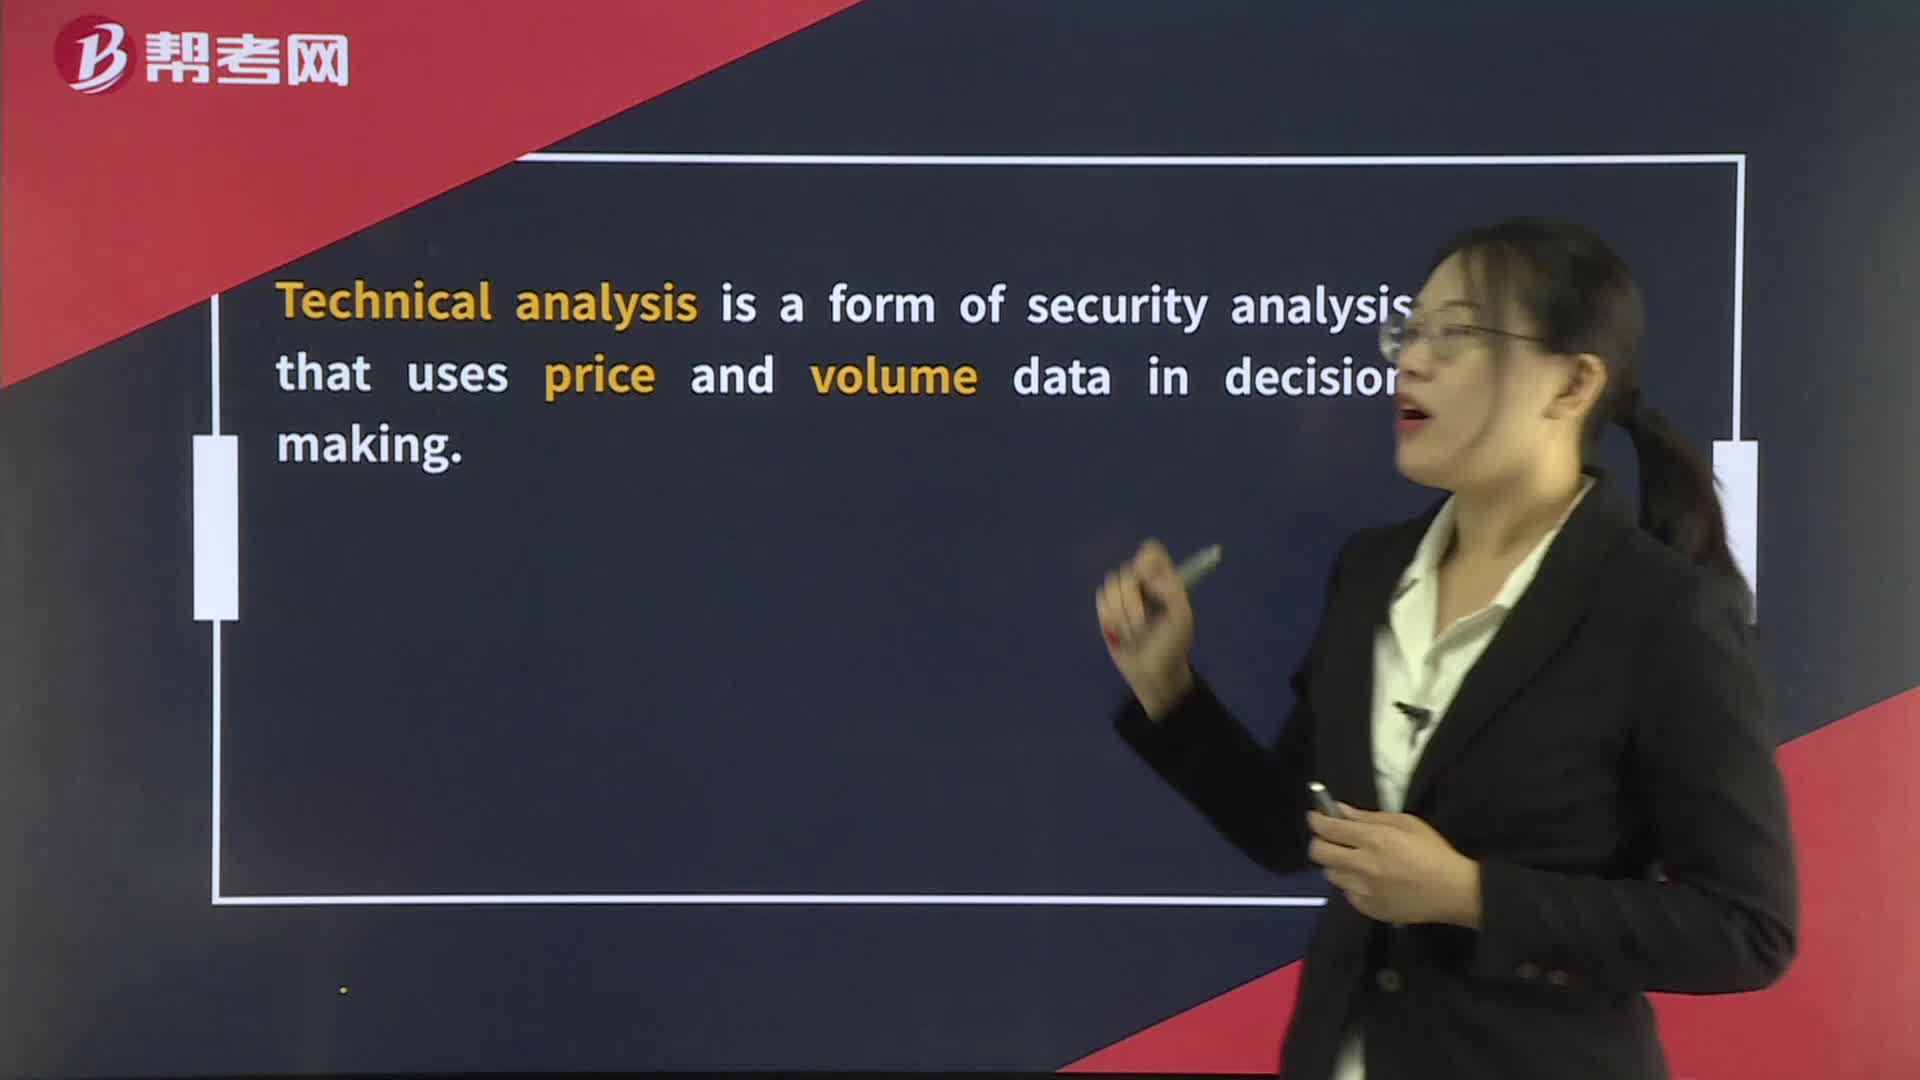
Technical Analysis:Technical:selling activity in a particular security.:appearsanalysisTechnicalanalysis
