Technical Analysis Tools— Chart Patterns
362 播放时长:23
加载播放器...
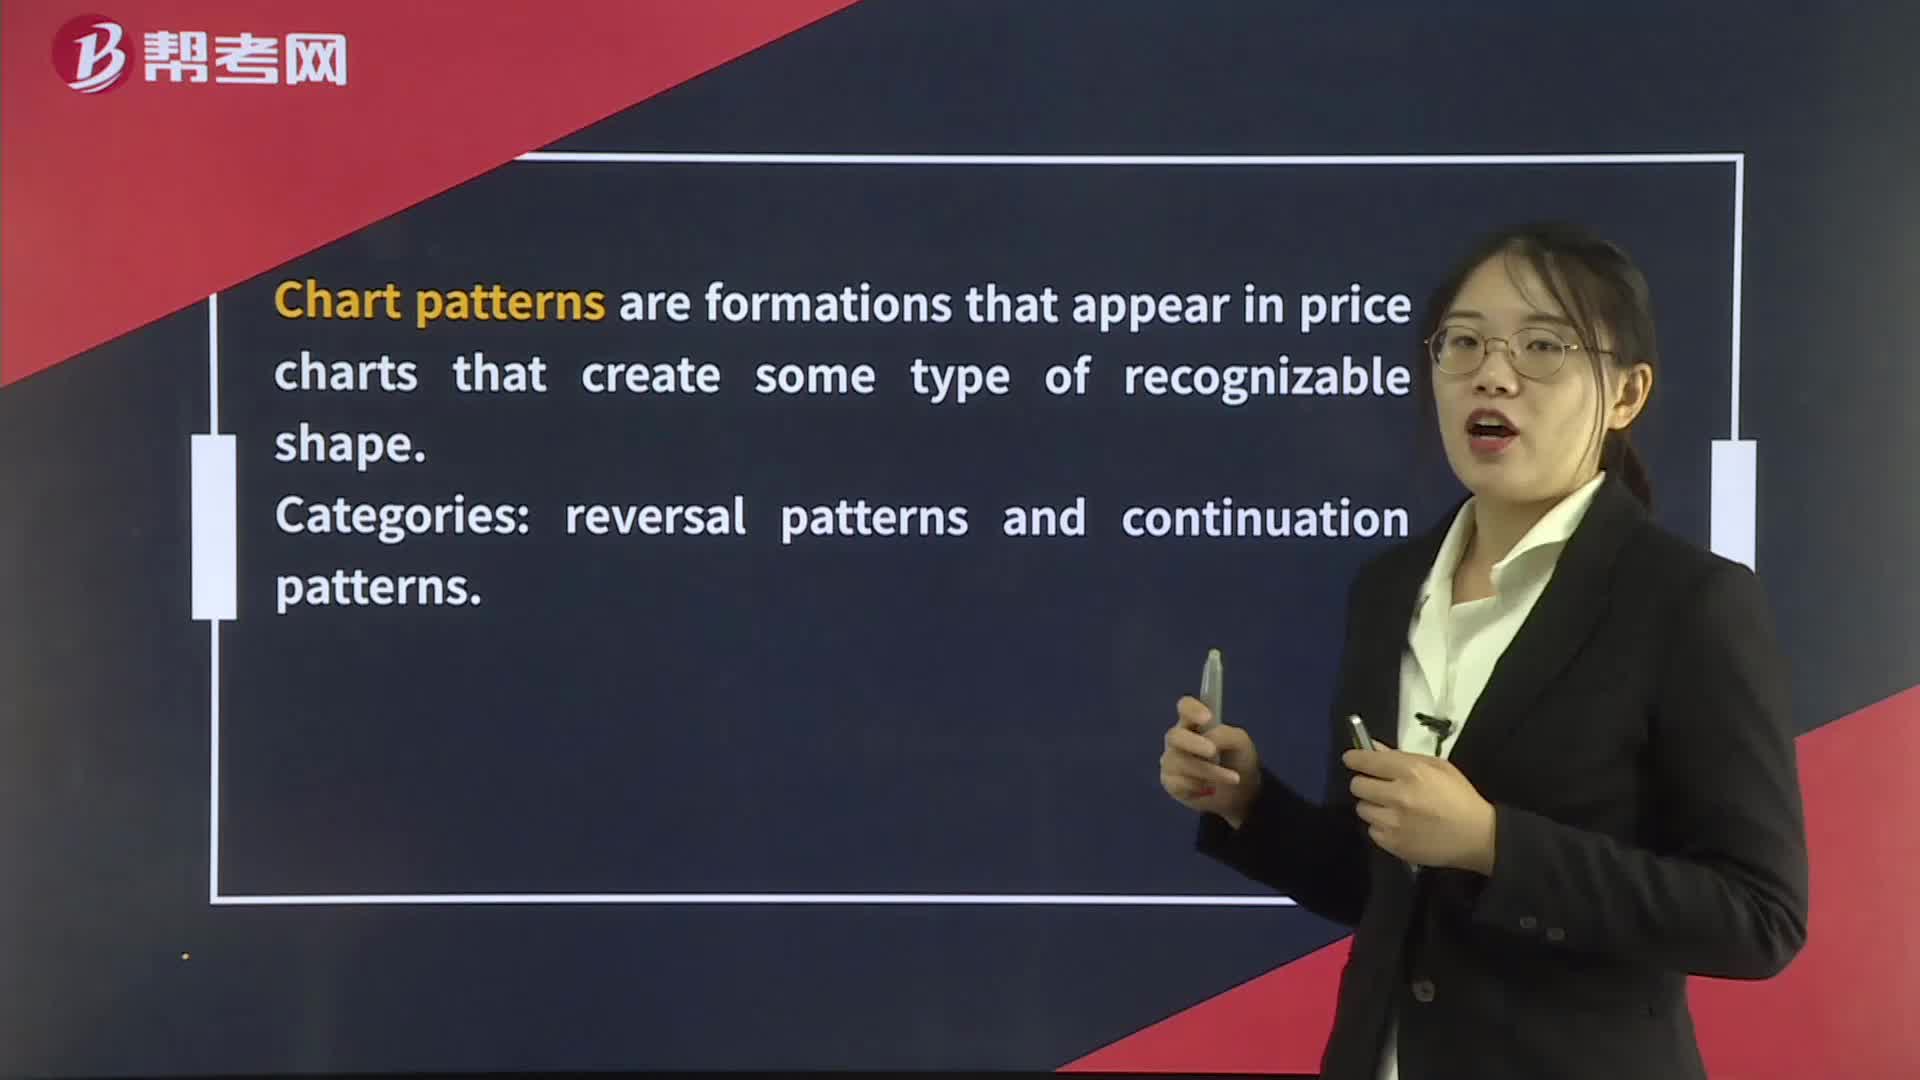
Technical Analysis Tools— Chart Patterns:ChartCategoriespatterns.
Chart patterns are technical analysis tools that traders use to identify potential trend reversals or continuations in financial markets. These patterns are formed by price movements on a chart, and they can provide valuable information about the market's direction and sentiment.
There are two main types of chart patterns: reversal patterns and continuation patterns. Reversal patterns signal a potential change in the direction of the current trend, while continuation patterns suggest that the current trend will continue.
Some of the most common chart patterns include:
1. Head and Shoulders: This is a reversal pattern that forms when the price of an asset creates three peaks, with the middle peak being the highest (the head) and the other two peaks being lower (the shoulders).
2. Double Top/Bottom: This is a reversal pattern that occurs when the price of an asset creates two peaks (double top) or two valleys (double bottom) at approximately the same price level.
3. Triangle: This is a continuation pattern that forms when the price of an asset creates a series of higher lows and lower highs (ascending triangle) or lower lows and higher highs (descending triangle).
4. Flag and Pennant: These are continuation patterns that occur when the price of an asset experiences a brief pause in its trend before continuing in the same direction.
5. Cup and Handle: This is a continuation pattern that forms when the price of an asset creates a rounded bottom (the cup) followed by a small dip (the handle) before continuing in an upward trend.
Chart patterns can be useful tools for traders to identify potential trading opportunities and manage risk. However, it is important to remember that chart patterns are not always reliable indicators, and traders should always use additional technical and fundamental analysis before making any trading decisions.
There are two main types of chart patterns: reversal patterns and continuation patterns. Reversal patterns signal a potential change in the direction of the current trend, while continuation patterns suggest that the current trend will continue.
Some of the most common chart patterns include:
1. Head and Shoulders: This is a reversal pattern that forms when the price of an asset creates three peaks, with the middle peak being the highest (the head) and the other two peaks being lower (the shoulders).
2. Double Top/Bottom: This is a reversal pattern that occurs when the price of an asset creates two peaks (double top) or two valleys (double bottom) at approximately the same price level.
3. Triangle: This is a continuation pattern that forms when the price of an asset creates a series of higher lows and lower highs (ascending triangle) or lower lows and higher highs (descending triangle).
4. Flag and Pennant: These are continuation patterns that occur when the price of an asset experiences a brief pause in its trend before continuing in the same direction.
5. Cup and Handle: This is a continuation pattern that forms when the price of an asset creates a rounded bottom (the cup) followed by a small dip (the handle) before continuing in an upward trend.
Chart patterns can be useful tools for traders to identify potential trading opportunities and manage risk. However, it is important to remember that chart patterns are not always reliable indicators, and traders should always use additional technical and fundamental analysis before making any trading decisions.
CFA考试视频Technical Analysis Tools— Chart PatternsCFA一级视频