Technical Analysis Tools— Reversal Patterns
470 播放时长:345
加载播放器...
Doublethe price is expected to appreciate above the peak between the two bottoms by at least the distance from the valley lows to the peak.
Reversal patterns are technical analysis tools that help traders identify potential trend reversals in the market. These patterns can be found on price charts and are formed by a series of price movements that indicate a shift in market sentiment.
Here are some common reversal patterns:
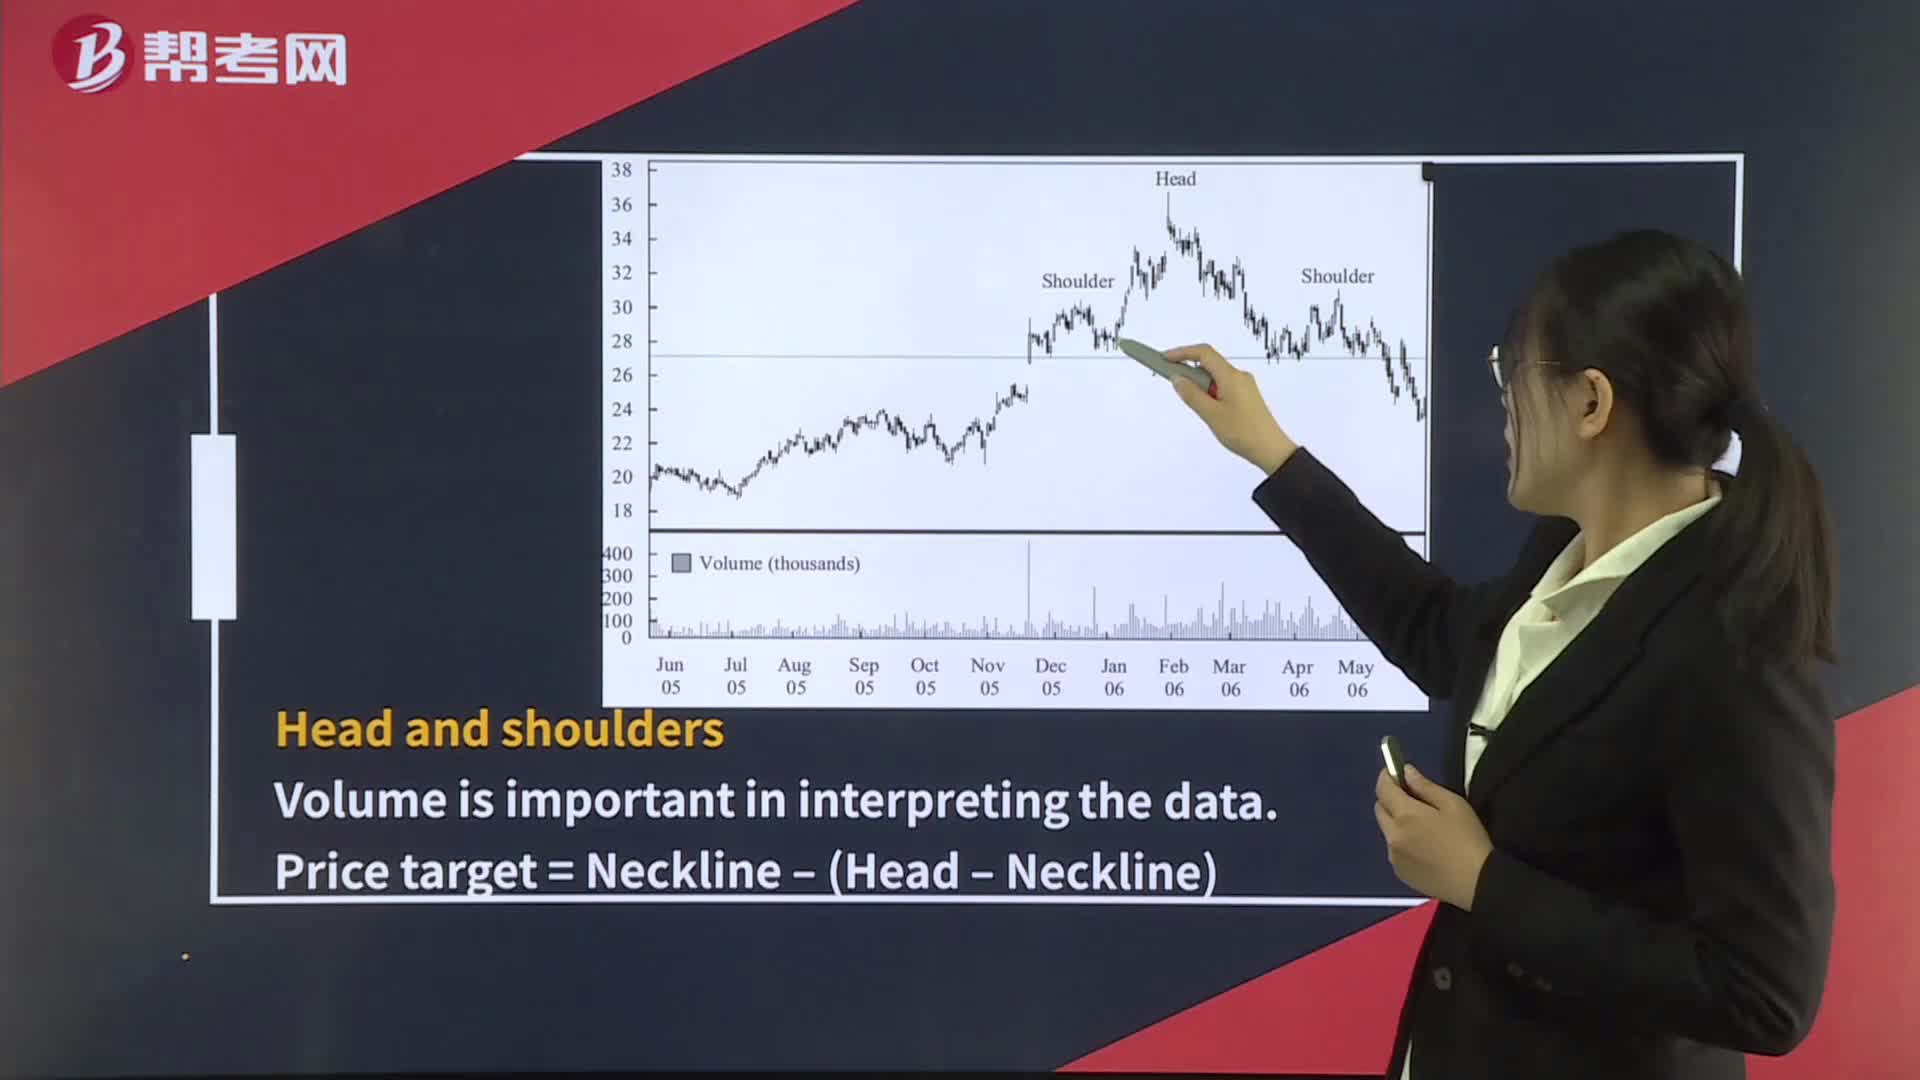
1. Head and Shoulders: This pattern is formed by three peaks, with the middle peak being the highest. The two smaller peaks on either side of the middle peak resemble shoulders, while the middle peak resembles the head. This pattern suggests a potential reversal from an uptrend to a downtrend.
2. Double Top/Bottom: This pattern is formed by two peaks or troughs of the same height, separated by a period of time. A double top indicates a potential reversal from an uptrend to a downtrend, while a double bottom suggests a potential reversal from a downtrend to an uptrend.
3. Triple Top/Bottom: This pattern is similar to the double top/bottom, but with three peaks or troughs of the same height. A triple top suggests a potential reversal from an uptrend to a downtrend, while a triple bottom suggests a potential reversal from a downtrend to an uptrend.
4. Wedge: This pattern is formed by two converging trend lines, with one line sloping upward and the other sloping downward. A wedge can be either a reversal or continuation pattern, depending on its direction and the preceding trend.
5. Head and Shoulders Inverse: This pattern is the opposite of the head and shoulders pattern, with the middle trough being the lowest. The two smaller troughs on either side of the middle trough resemble shoulders, while the middle trough resembles the head. This pattern suggests a potential reversal from a downtrend to an uptrend.
Overall, reversal patterns can be a useful tool for traders to identify potential trend changes in the market. However, it is important to consider other technical indicators and fundamental factors before making trading decisions.
CFA考试视频Technical Analysis Tools— Reversal PatternsCFA一级视频