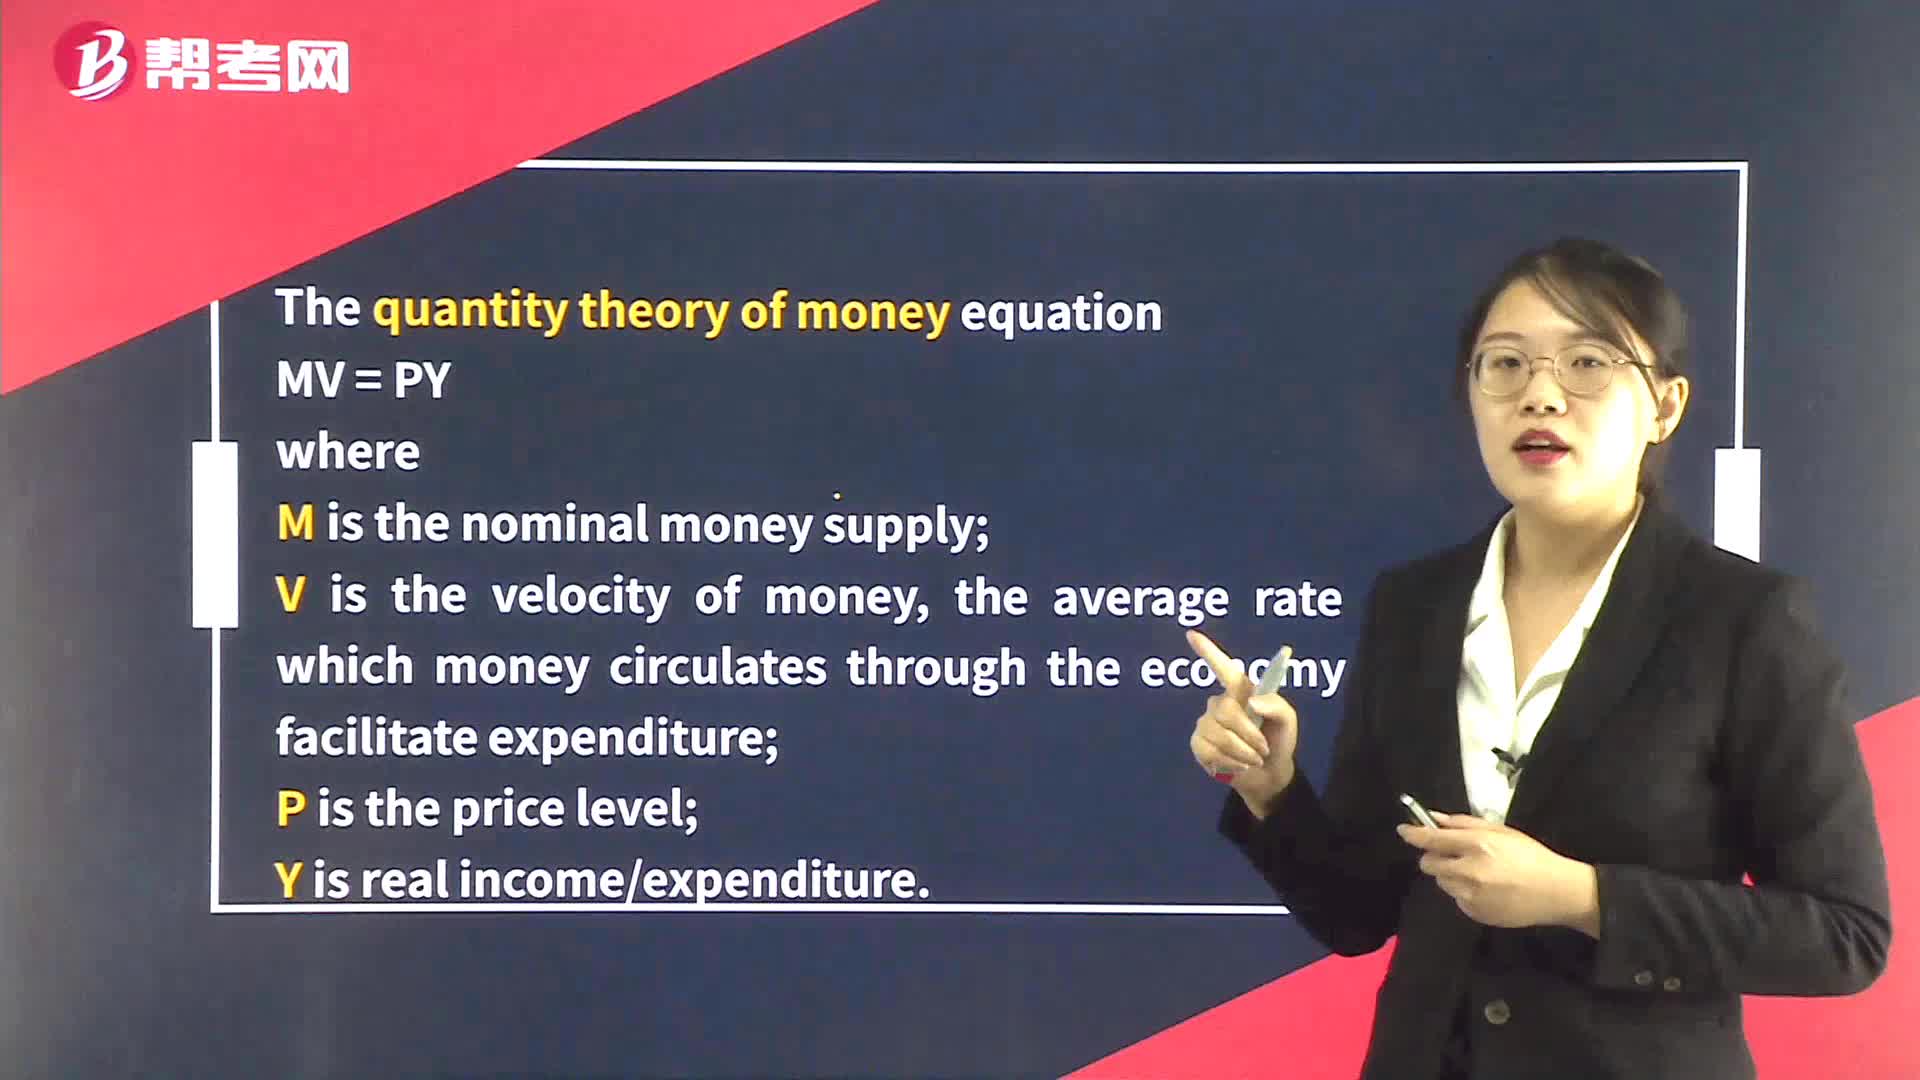
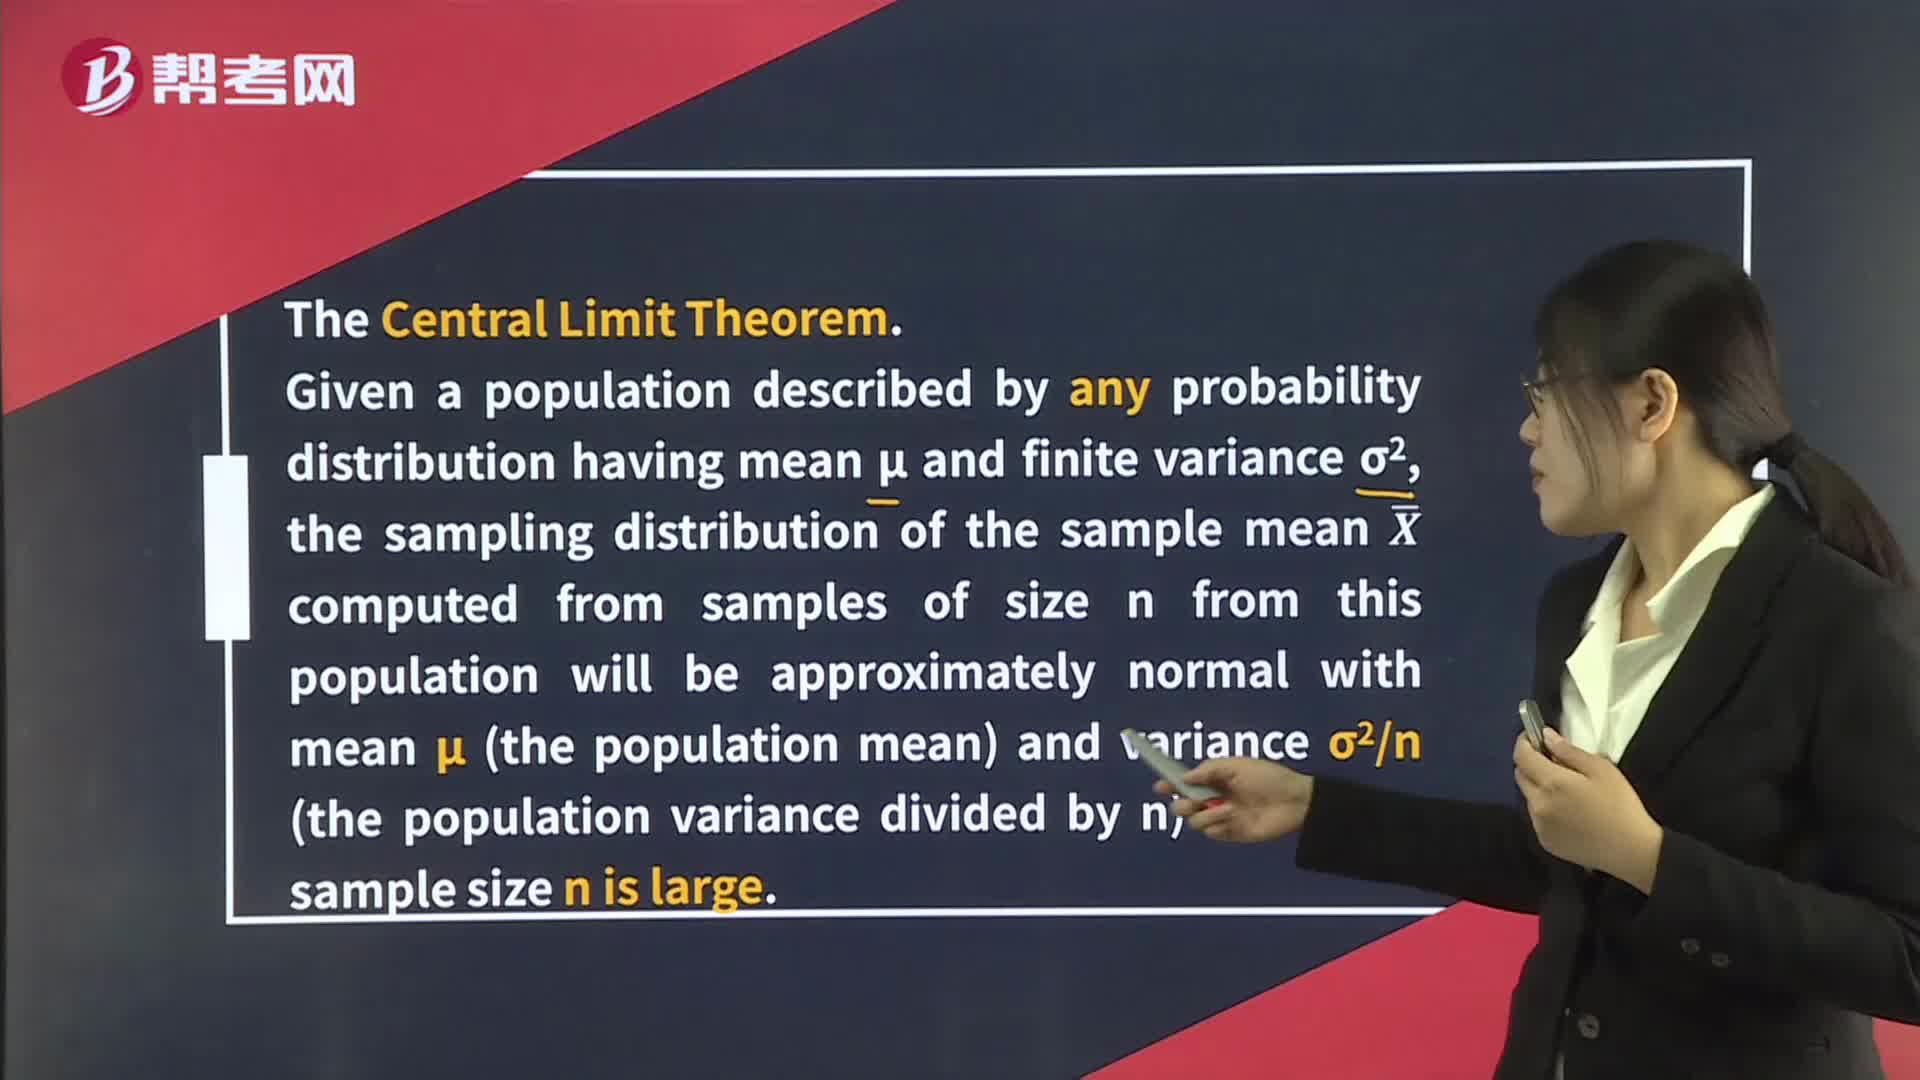
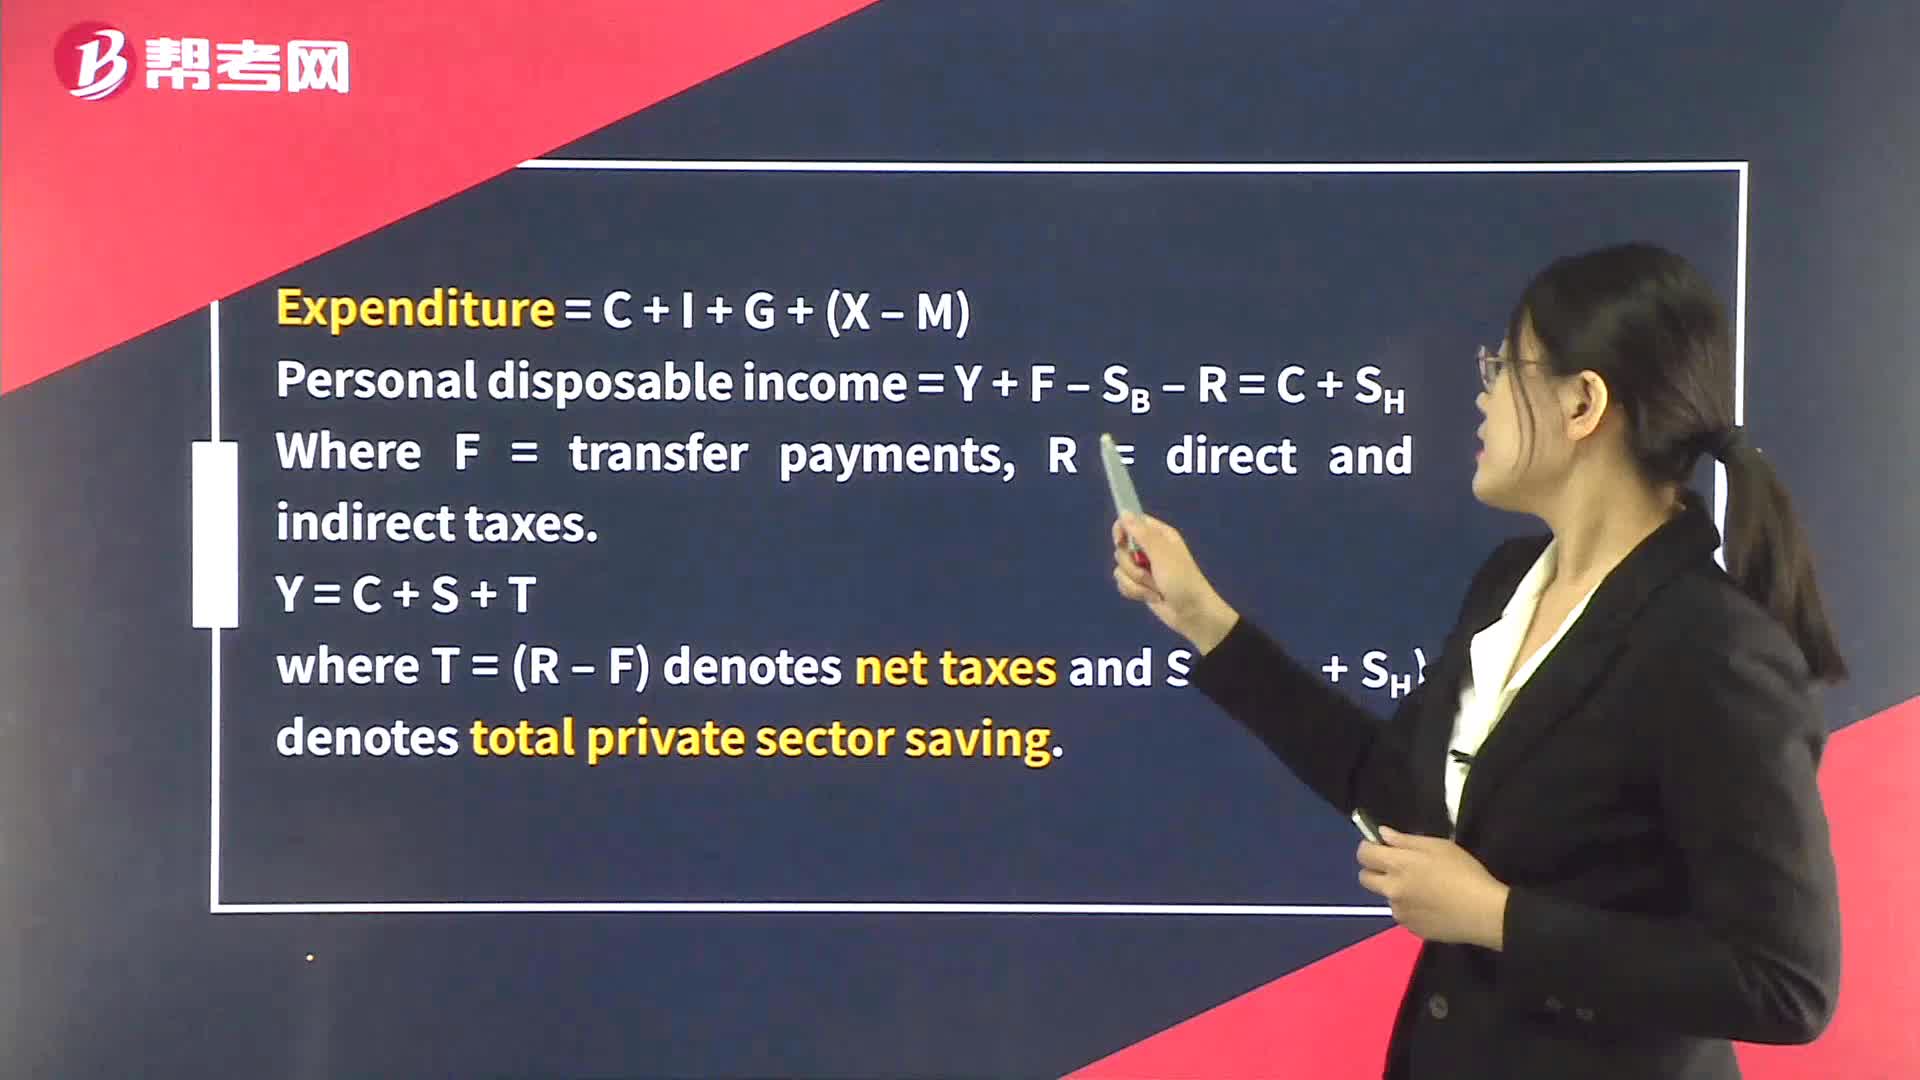
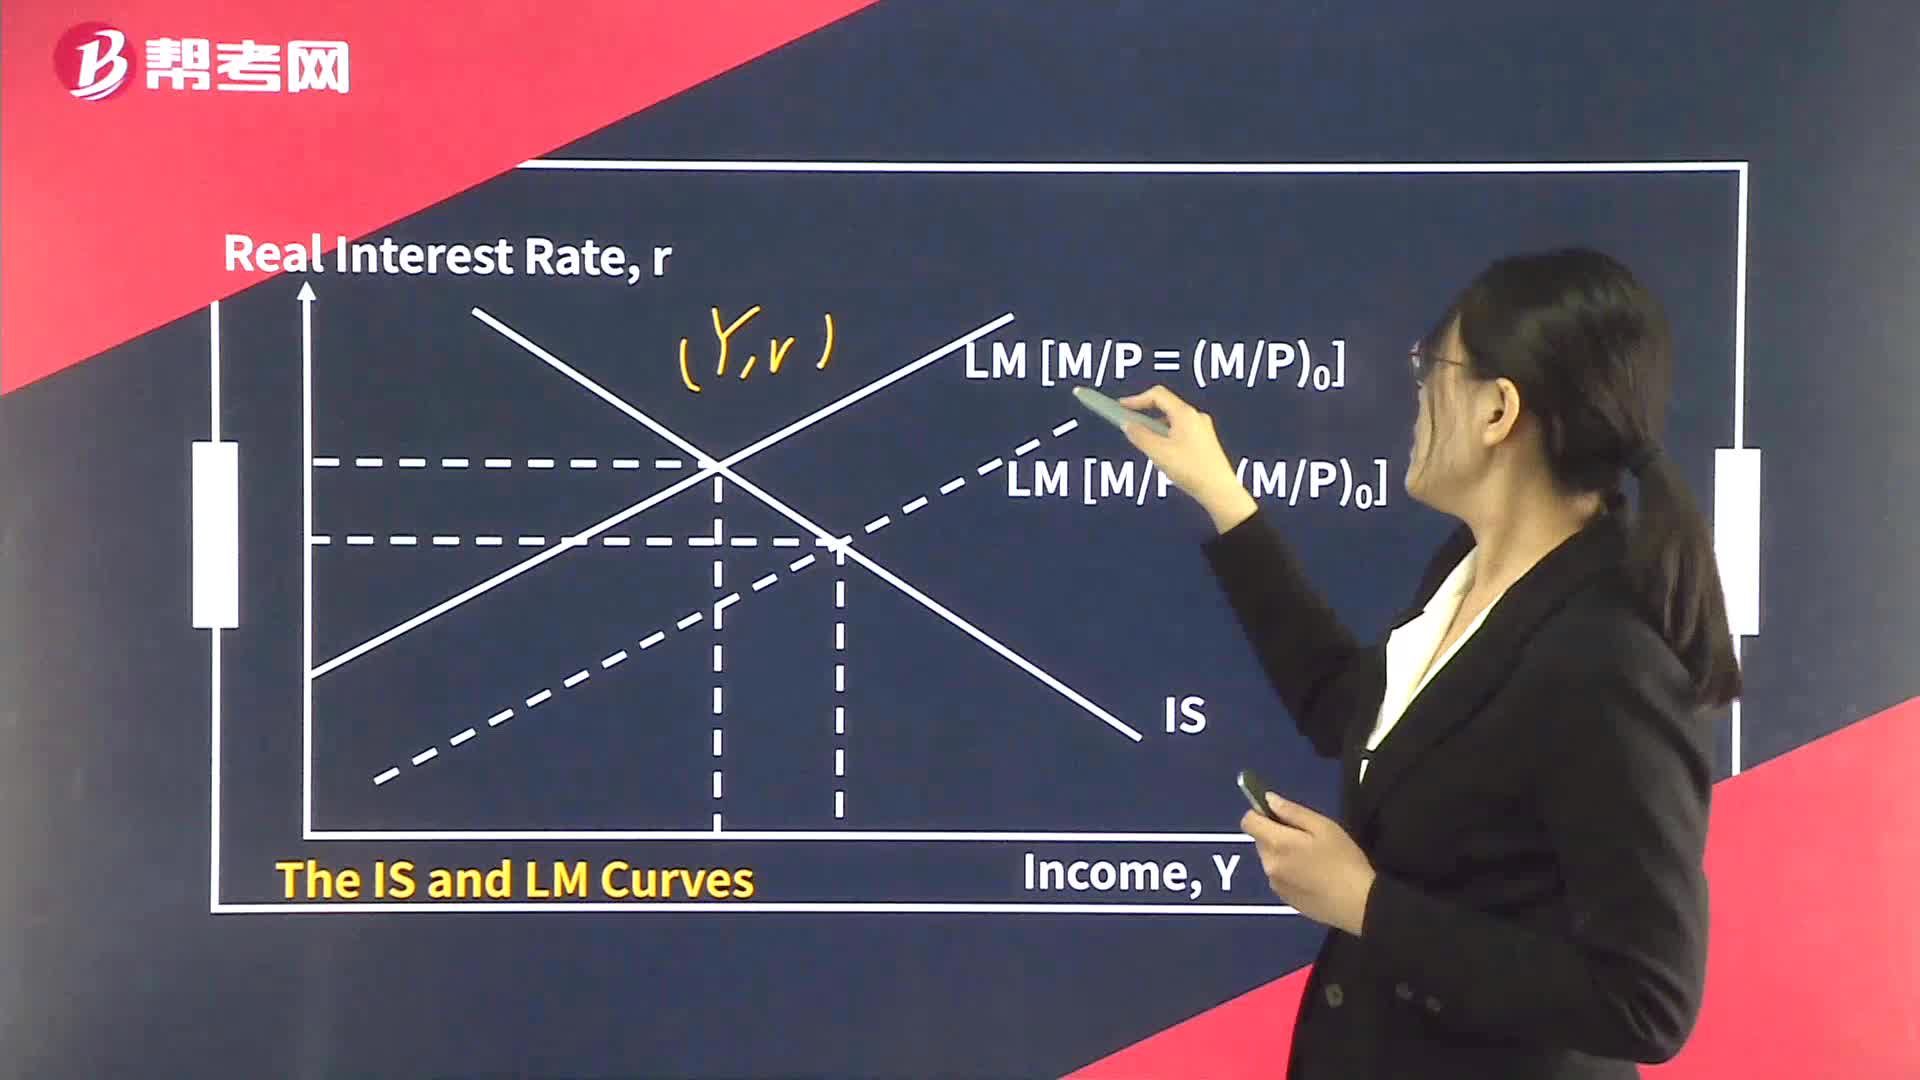
CFA考试相关视频

下载亿题库APP
联系电话:400-660-1360
下载亿题库APP
联系电话:400-660-1360

请谨慎保管和记忆你的密码,以免泄露和丢失
请谨慎保管和记忆你的密码,以免泄露和丢失
 02:16
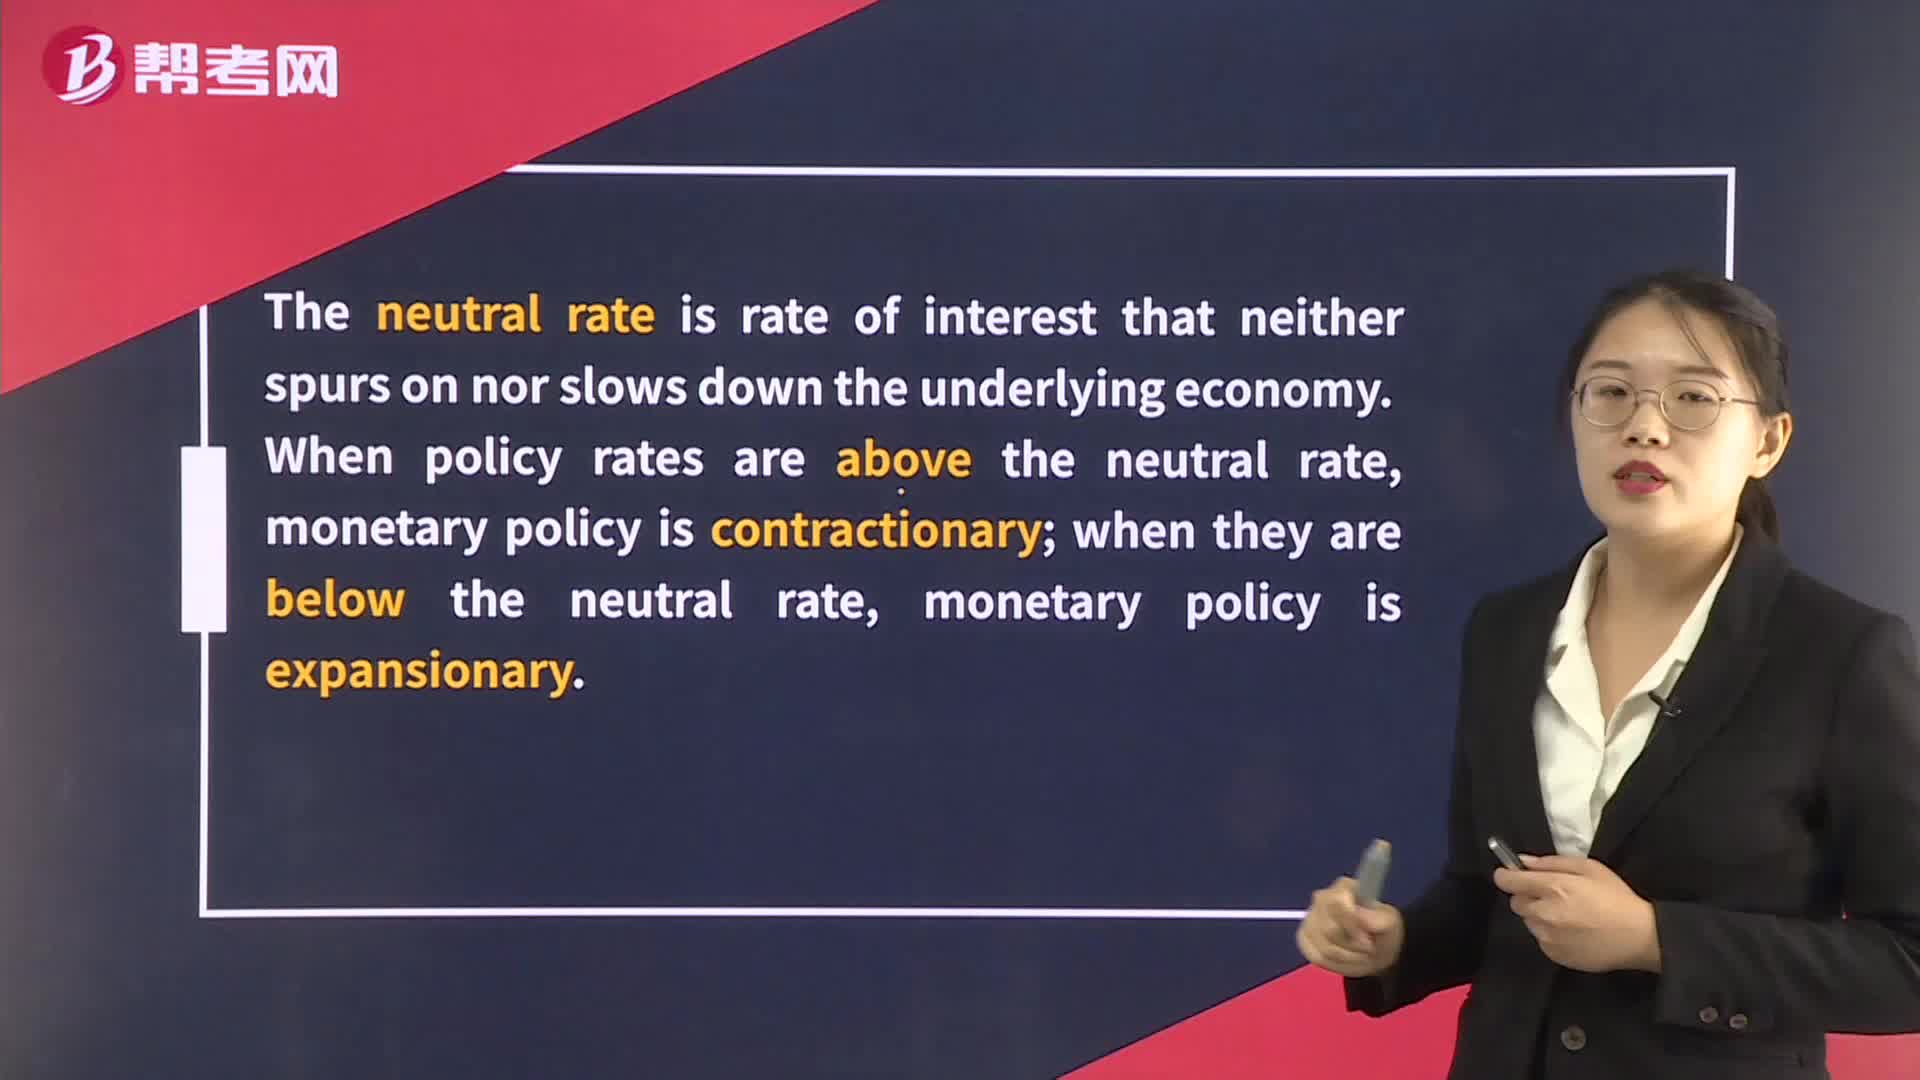
02:16The Neutral Rate:The neutral;underlying economy.:economyLong-runrates might make a bad situation worse.
 03:05
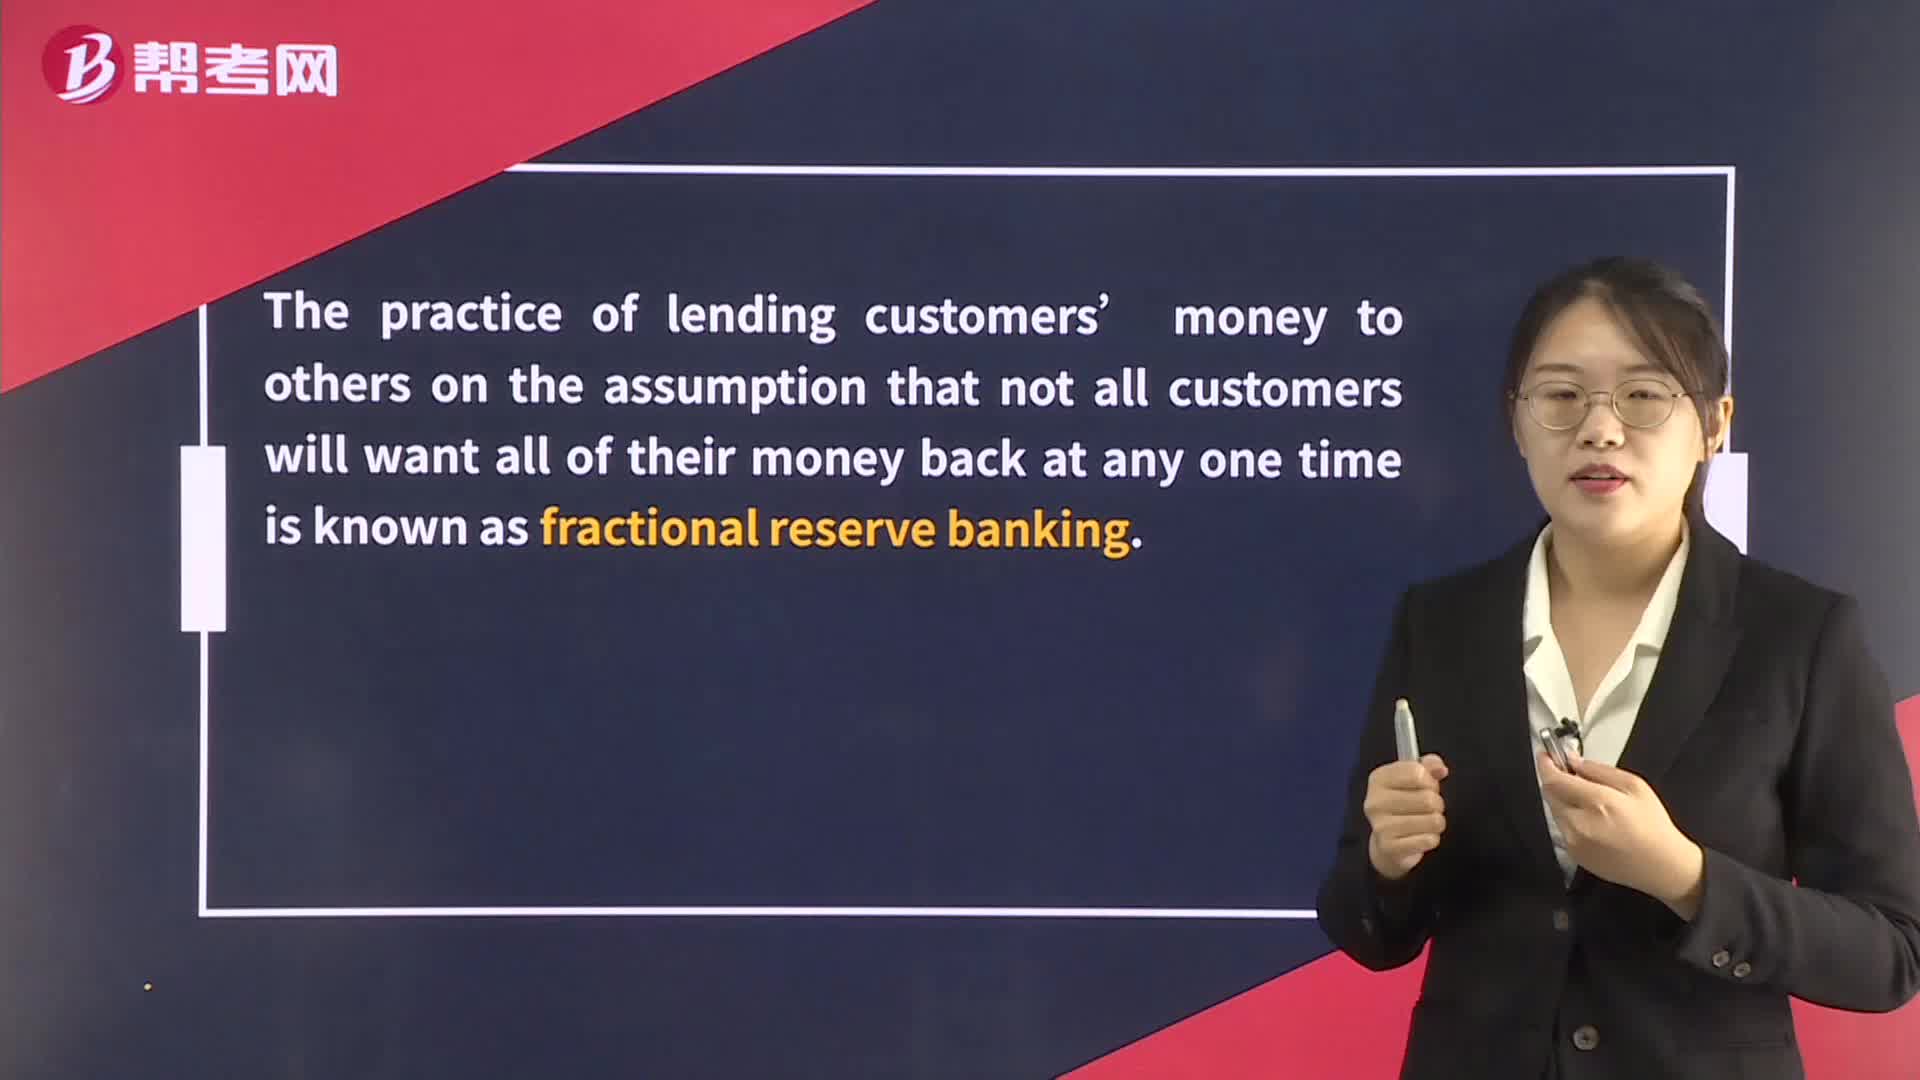
03:05The Money Creation Process:1 divided by the reserve requirement is the money multiplier.
 02:14
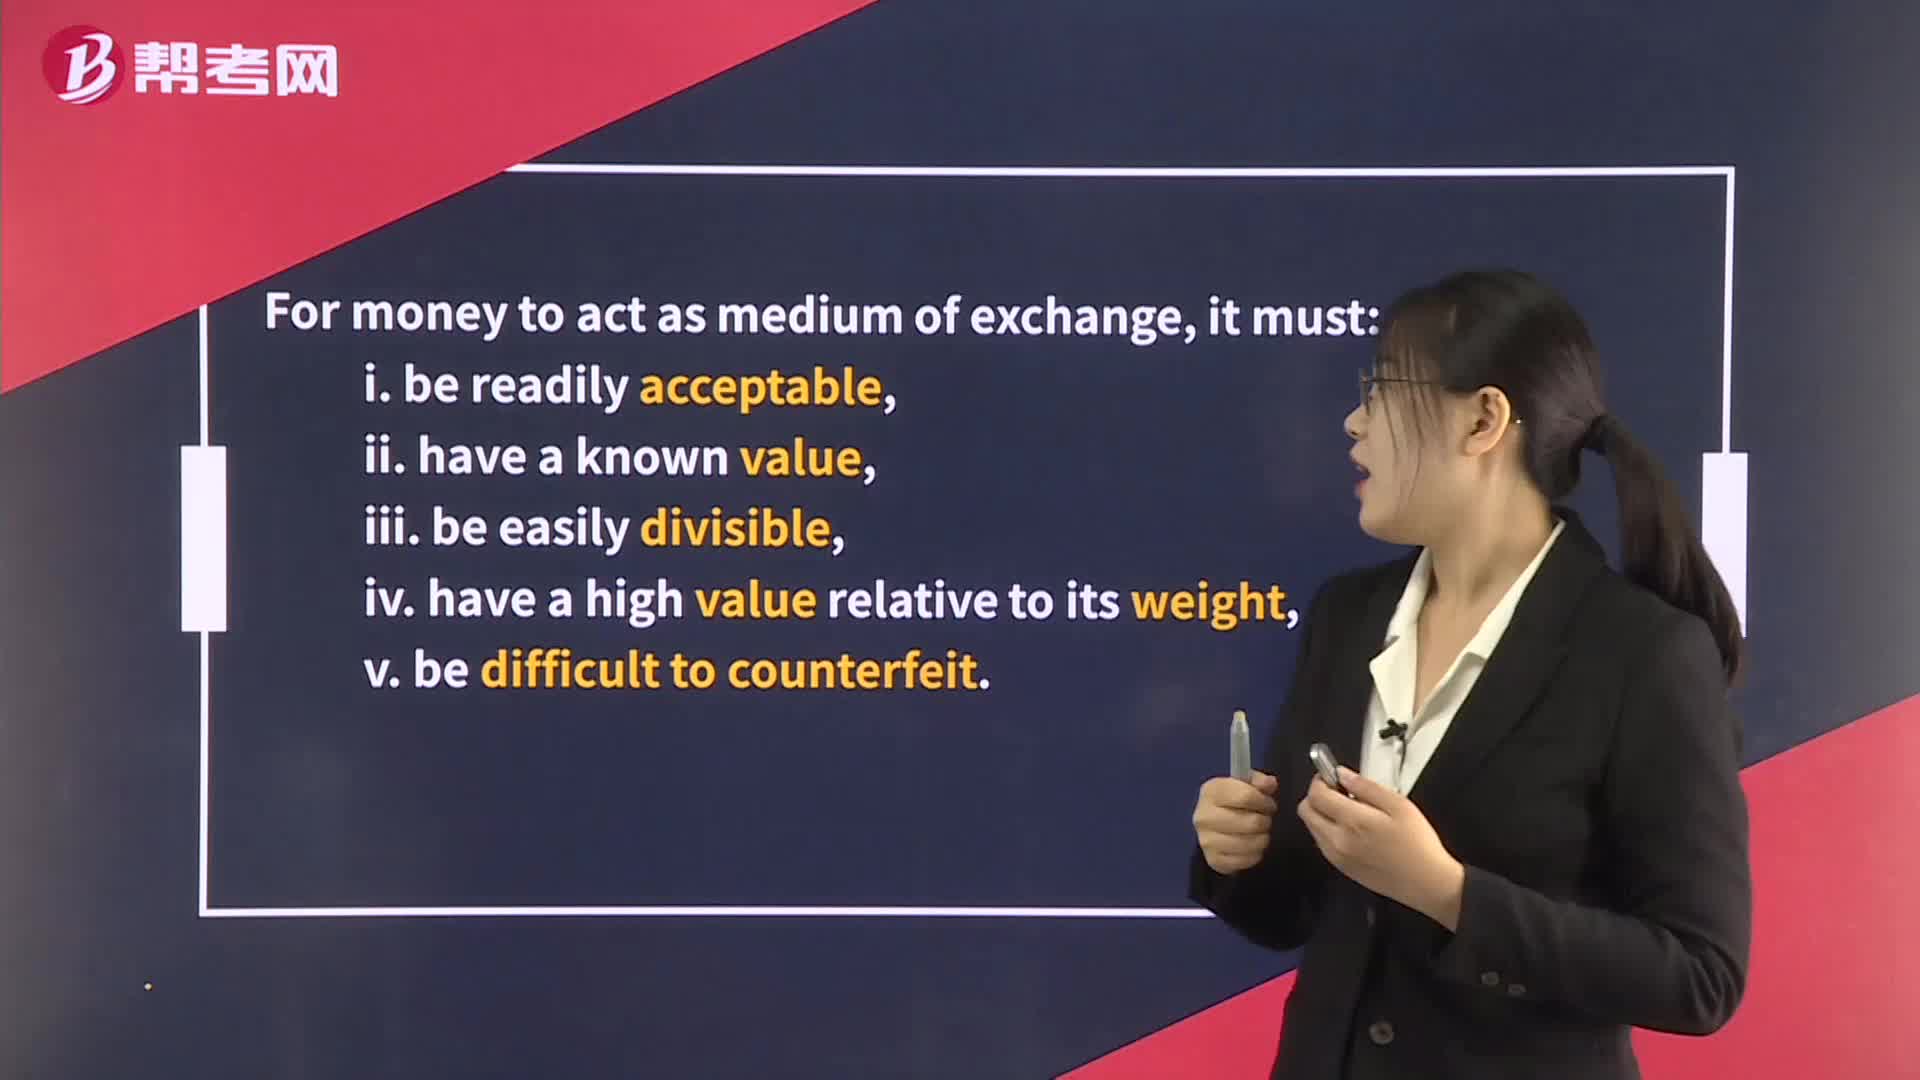
02:14The Functions of Money:iii. be easily divisible;provides society with a convenient measure of value and unit of account.
 01:30
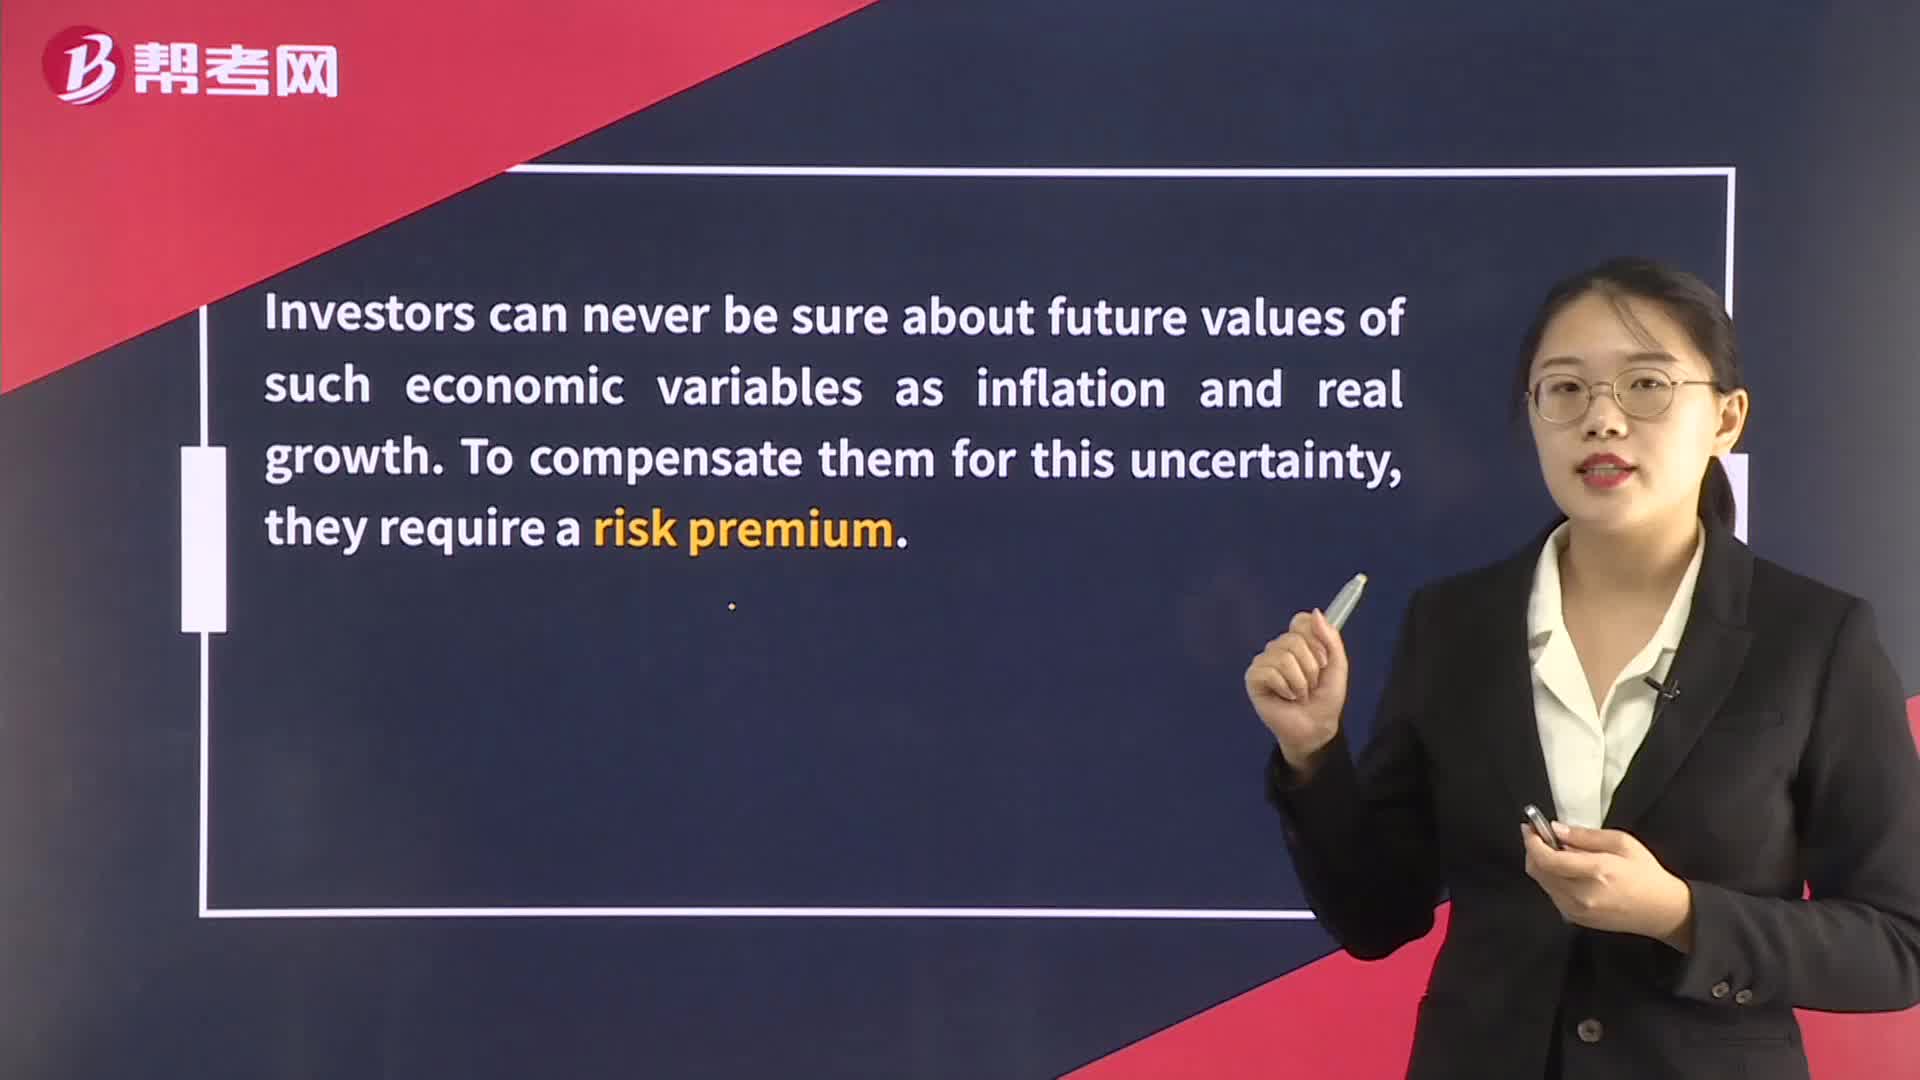
01:30The Fisher Effect:The Fisher:interest in an economy is stable over time so that changes in nominal interest rates are the result;premium.premium to compensate them for uncertainty.
 04:02
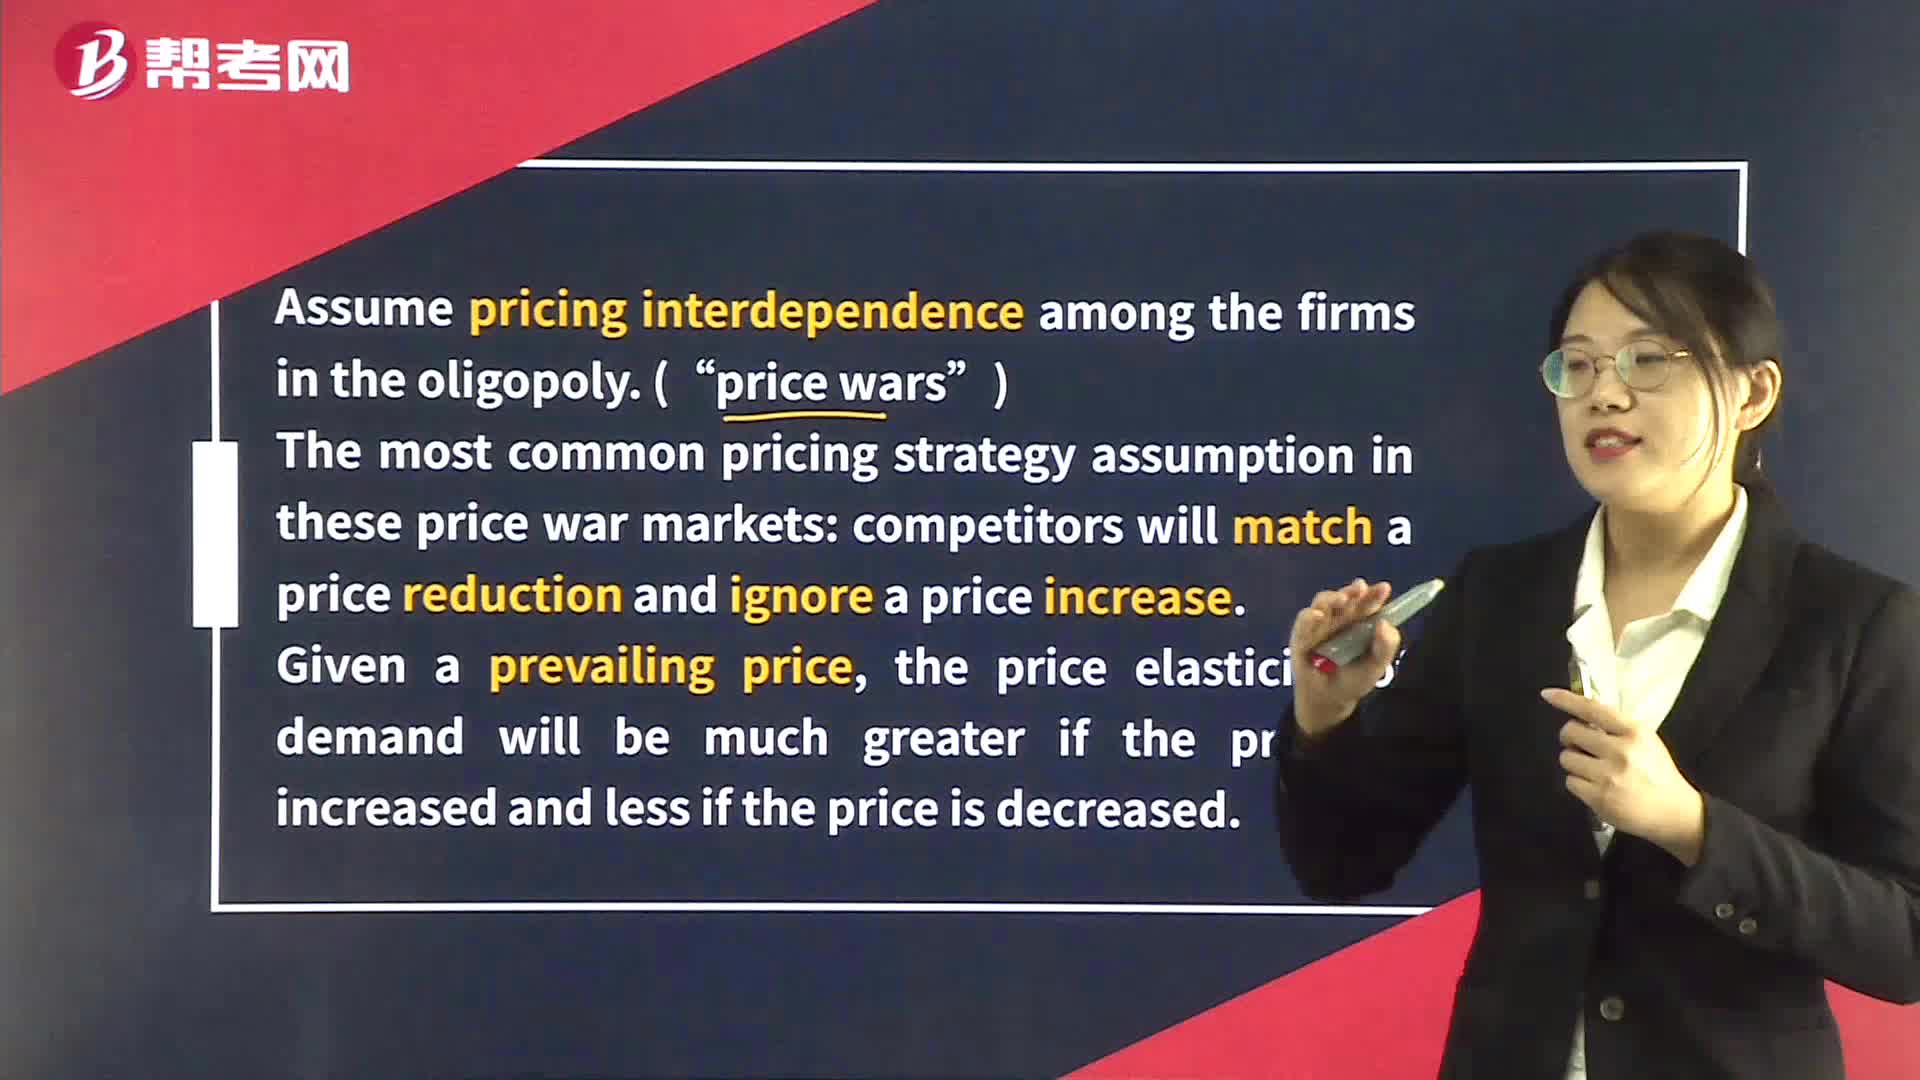
04:02Kinked Demand Curve in Oligopoly Market:priceincomplete pricing analysis.
 03:24
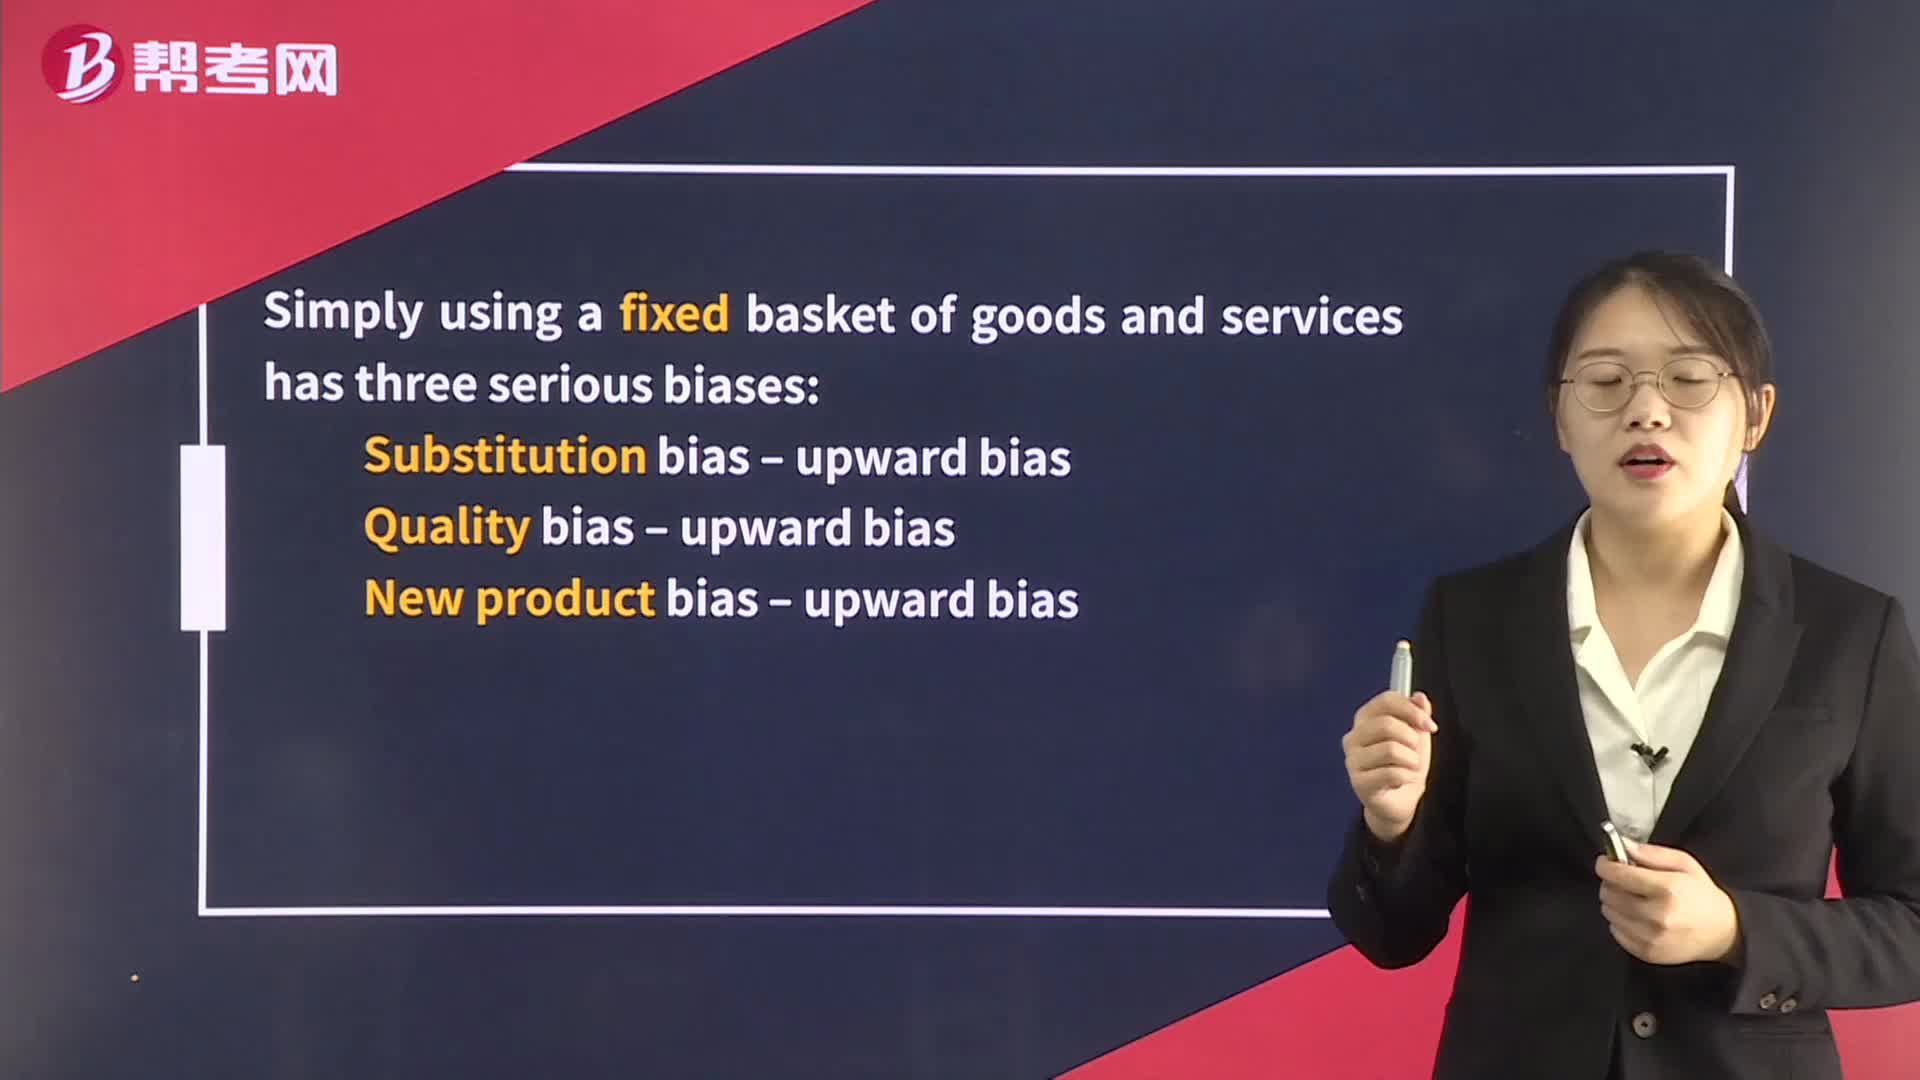
03:24The Construction of Price Indexes:be used to average the different prices.:index.the basket.
 04:31
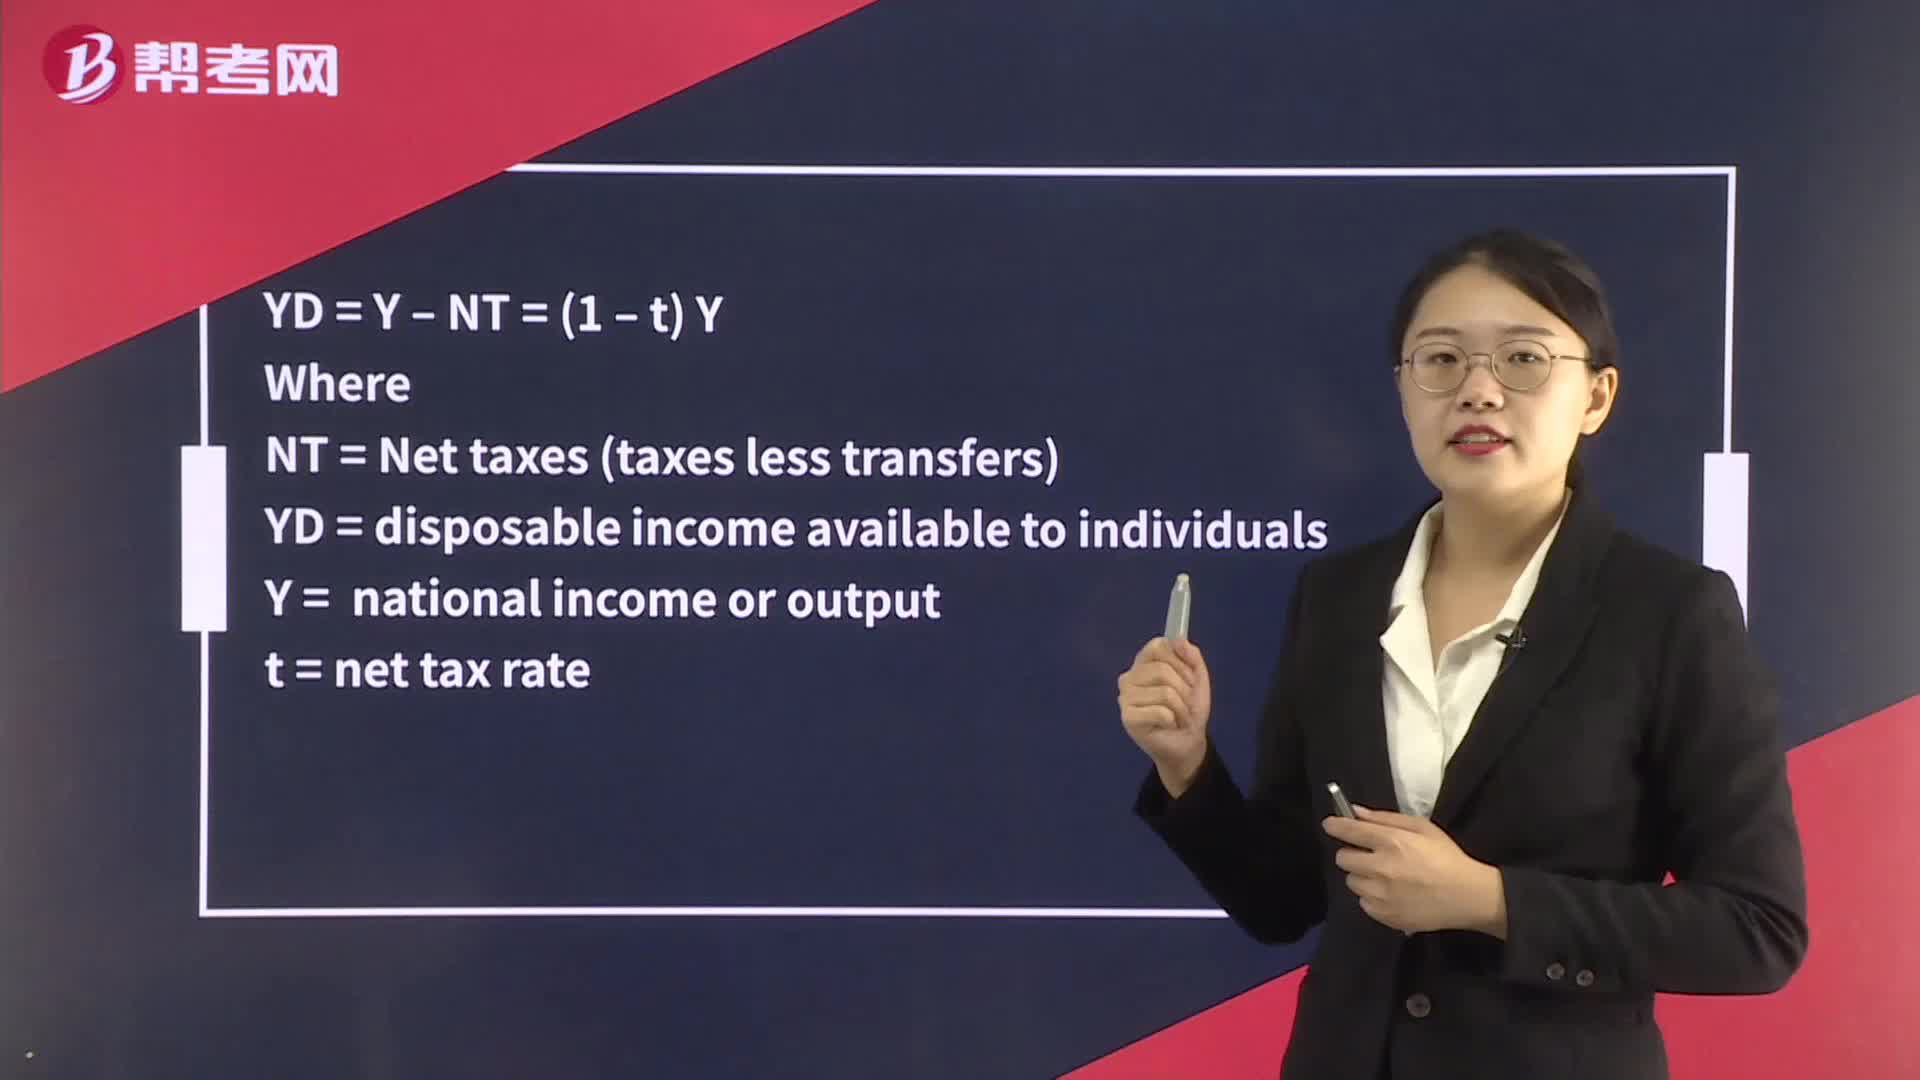
04:31The Fiscal Multiplier:Wheret = tax rate
 04:47
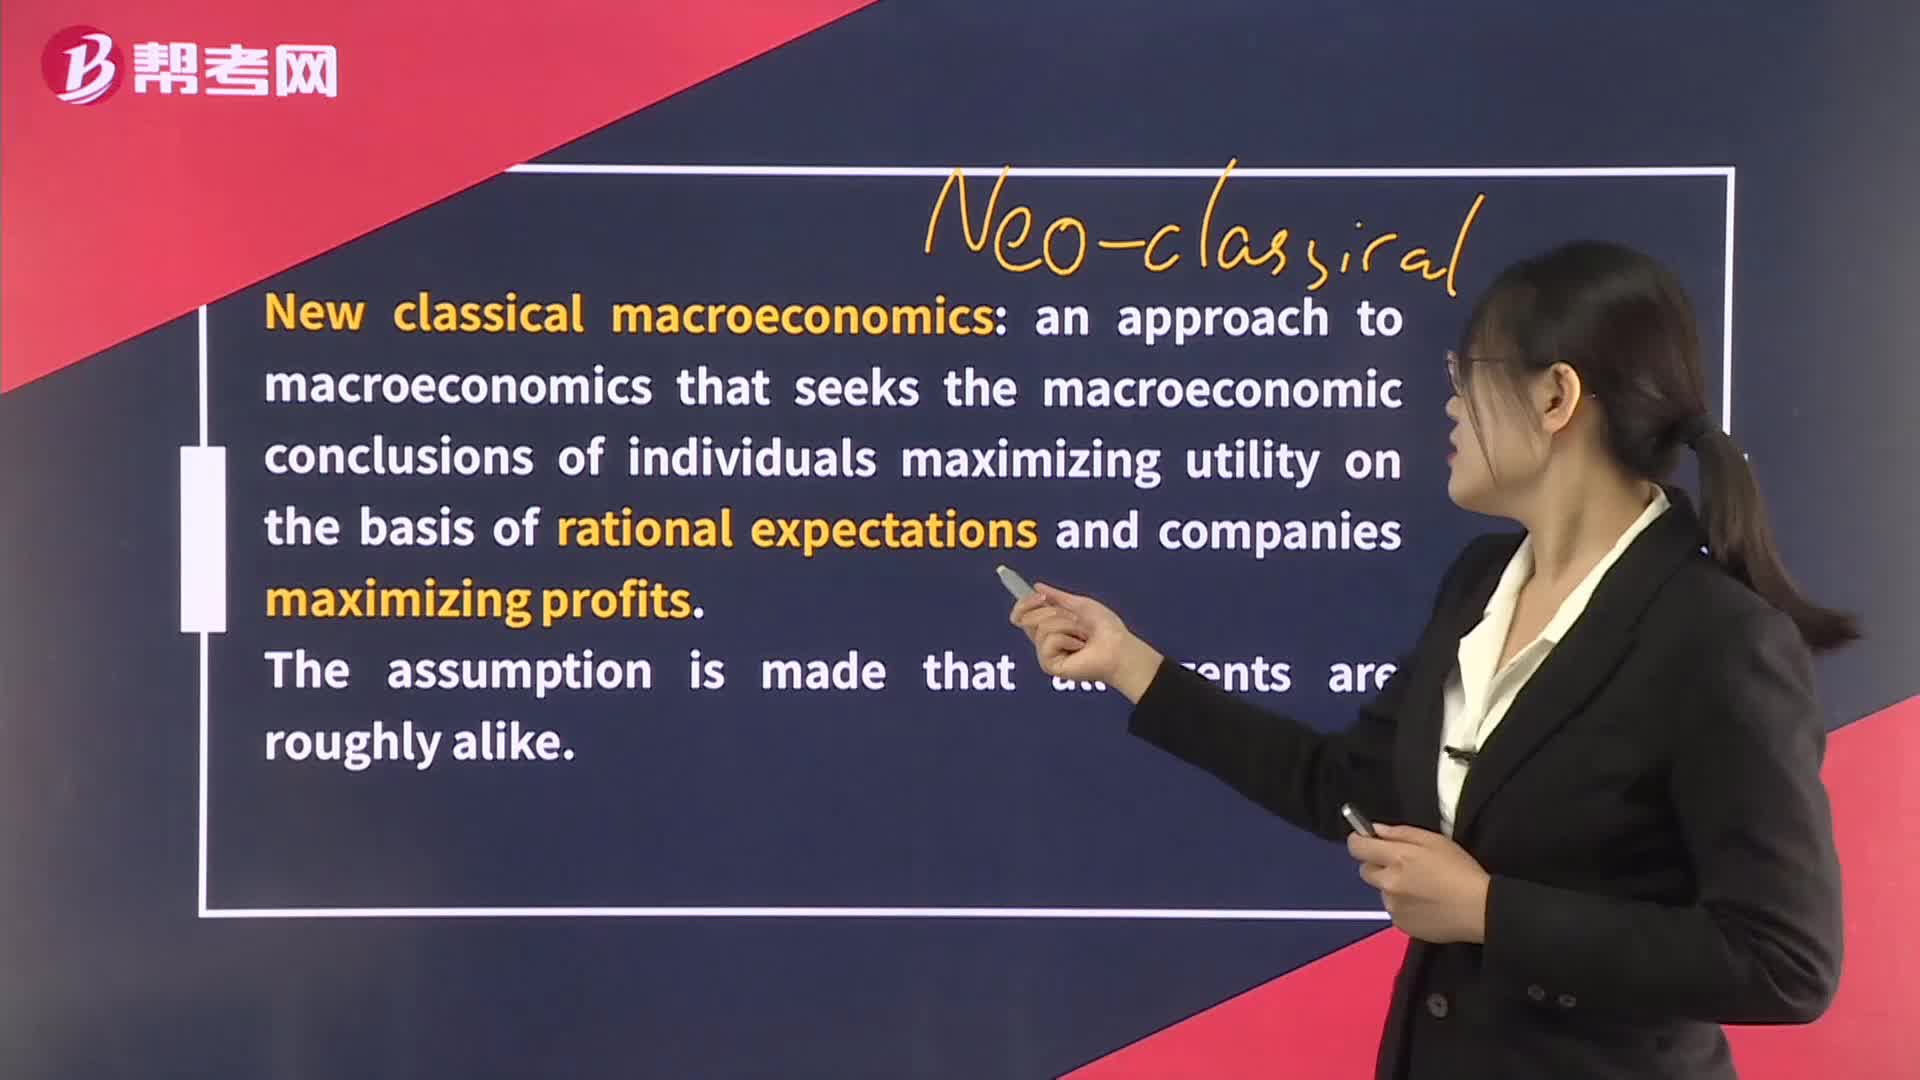
04:47The New Classical School:an approach to macroeconomics that seeks the:Money,technologymodelslow-to-adjusteconomy is weak.
 05:08
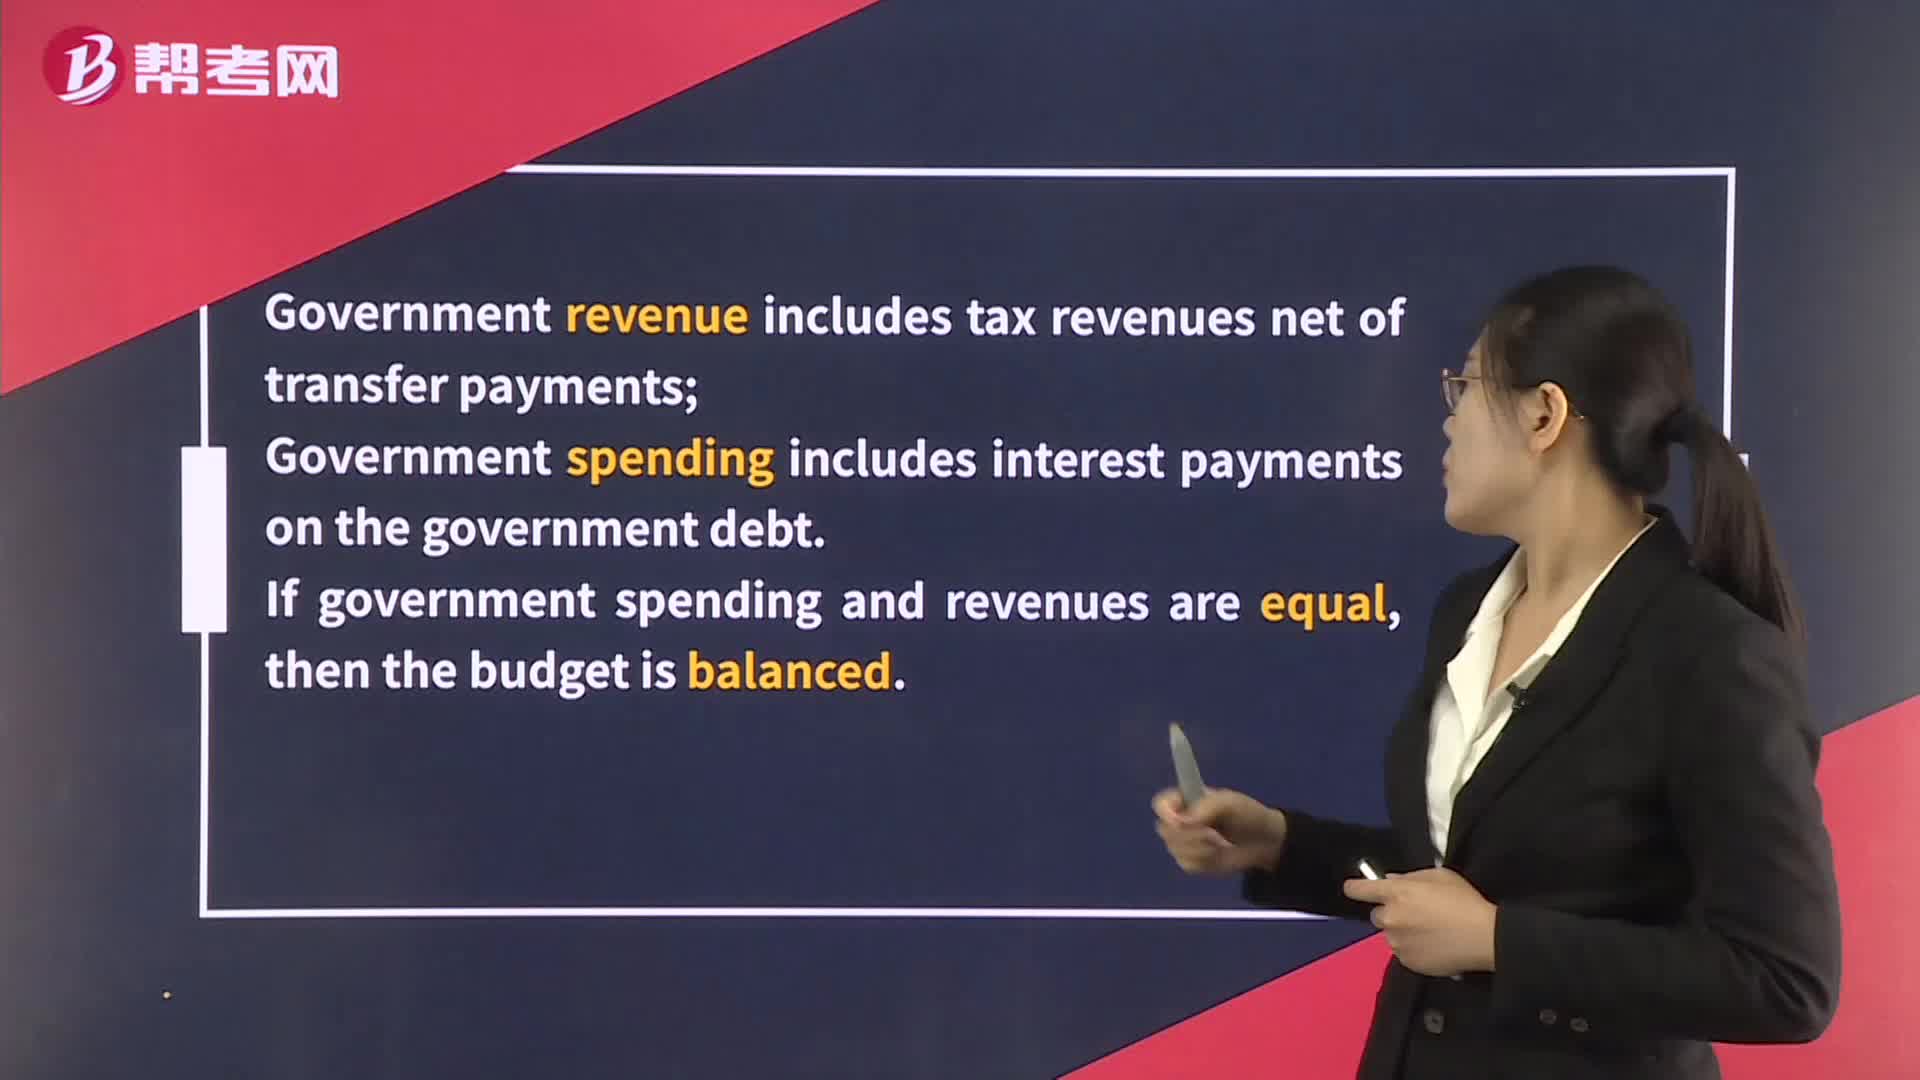
05:08Deficits and the National Debt:Budget;Government revenue includes tax revenues net of transfer payments;An increase in a budget surplus would be associated with contractionary fiscal policy:uses.
 04:25
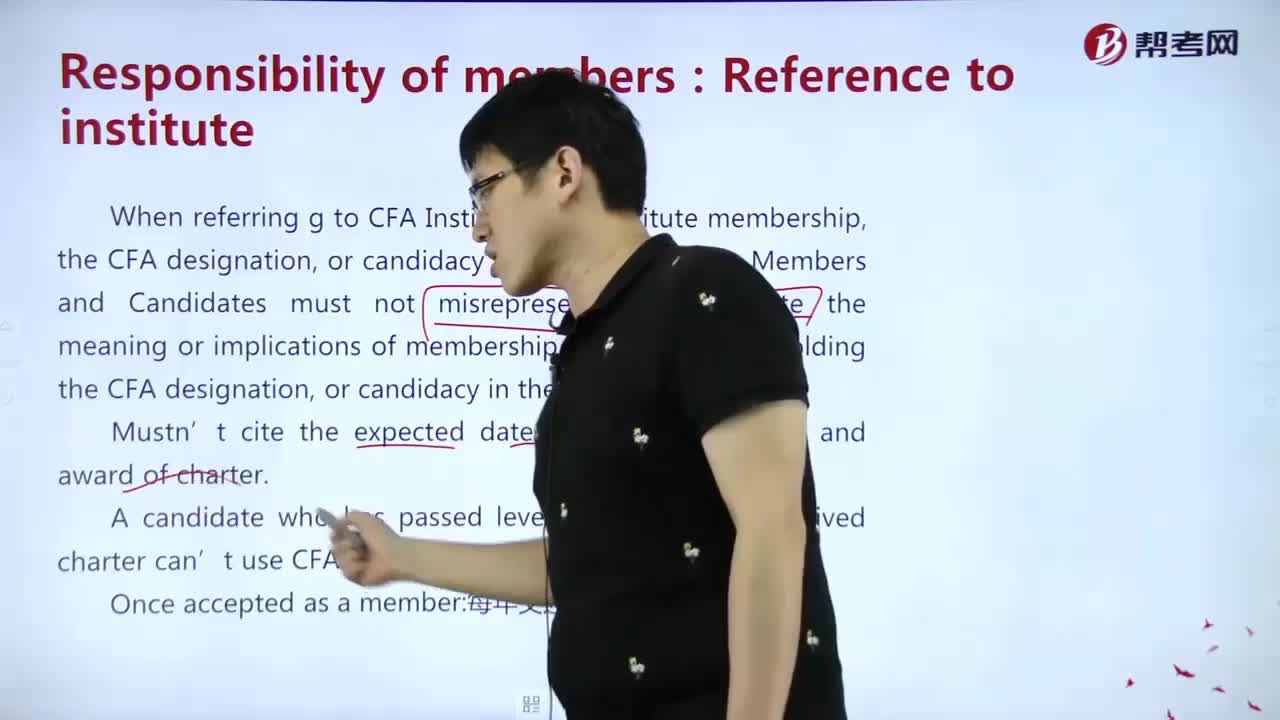
04:25What are the responsibilities of the members in reference to the CFA Institute?:Once accepted as a member:每年交述职报告和年费but must not over promise the competency and future investment results.Case
 06:50
06:50What are the ethics and trust in the investment profession?:Global investment performance standards(GIPS)= 比例低,也并非所有的不道德都是违法君子有所不为的决策是更好的决策更符合stakeholder利益的决策
 06:13
06:13What’s the responsibility of supervisors?:does not relieve them of their supervisory responsibility. (可以转委托他人监管,但必须指示明确且对转委托负责),应拒绝承担监管者责任),