下载亿题库APP
联系电话:400-660-1360
下载亿题库APP
联系电话:400-660-1360

请谨慎保管和记忆你的密码,以免泄露和丢失
请谨慎保管和记忆你的密码,以免泄露和丢失
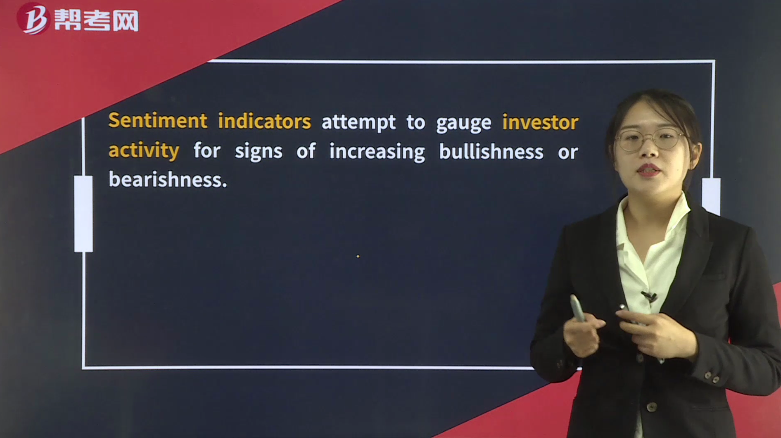
Technical Indicators— Sentiment indicators
Sentiment indicators attempt to gauge investor activity for signs of increasing bullishness or bearishness.
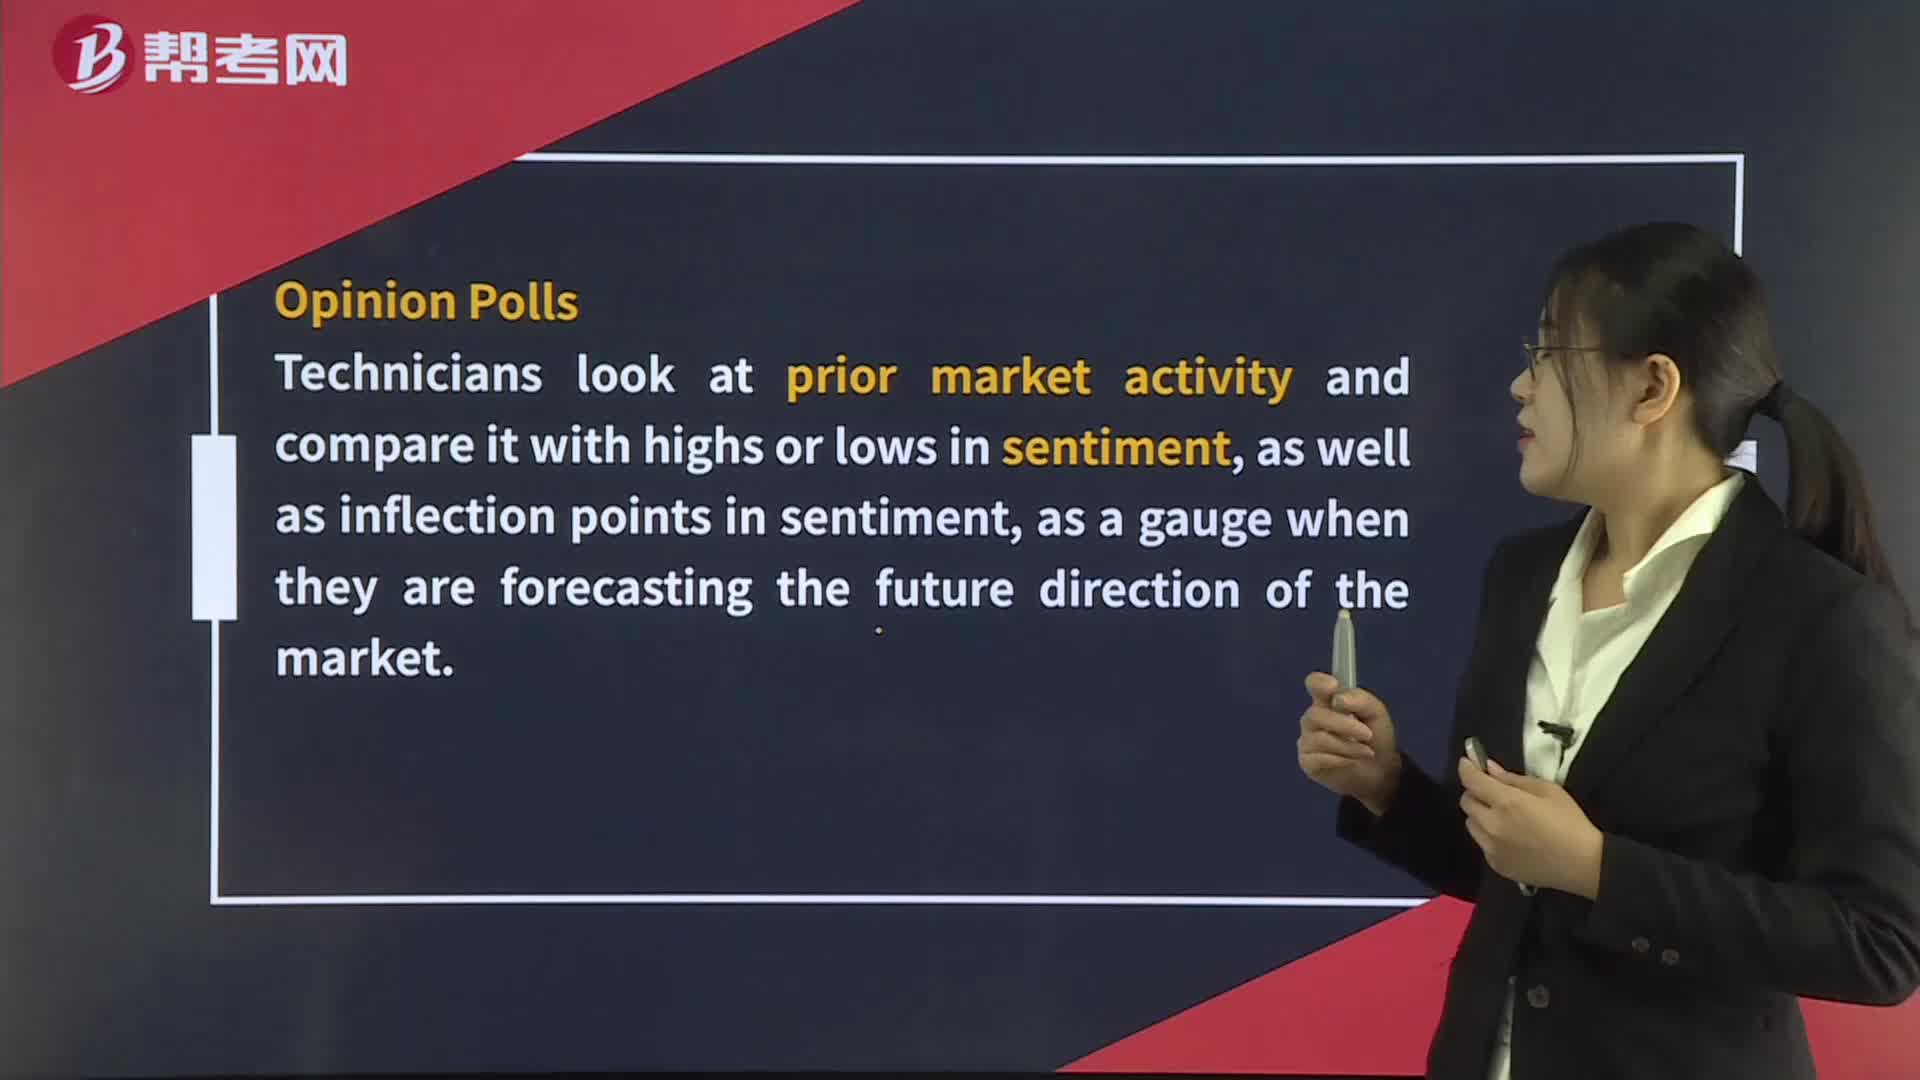
Opinion Polls
Technicians look at prior market activity and compare it with highs or lows in sentiment, as well as inflection points in sentiment, as a gauge when they are forecasting the future direction of the market.
Put/call ratio is the volume of put options traded divided by the volume of call options traded for a particular financial instrument. Normally below 1.0. Considered contrarian indicator.
At extreme lows, market sentiment overly positive, correction is likely.
At extreme highs, market sentiment extremely negative, an increase in price is likely.
The CBOE Volatility Index (VIX) is a measure of near-term market volatility calculated by the Chicago Board Options Exchange.
The VIX rises when market participants become fearful of an impending market decline.
When other indicators suggest that the market is oversold and the VIX is at an extreme high, this combination is considered bullish.
Margin debt.
When stock margin debt is increasing, investors are aggressively buying and stock prices will move higher because of increased demand.
Rising margin debt is generally associated with a rising index level, and falling margin debt is associated with a falling index level.
Short interest.
The number of shares of a particular security that are currently sold short is called “short interest.”
Short interest ratio = Short interest/Average daily trading volume
Opinions differ about how to interpret short interest as an indicator.
 183
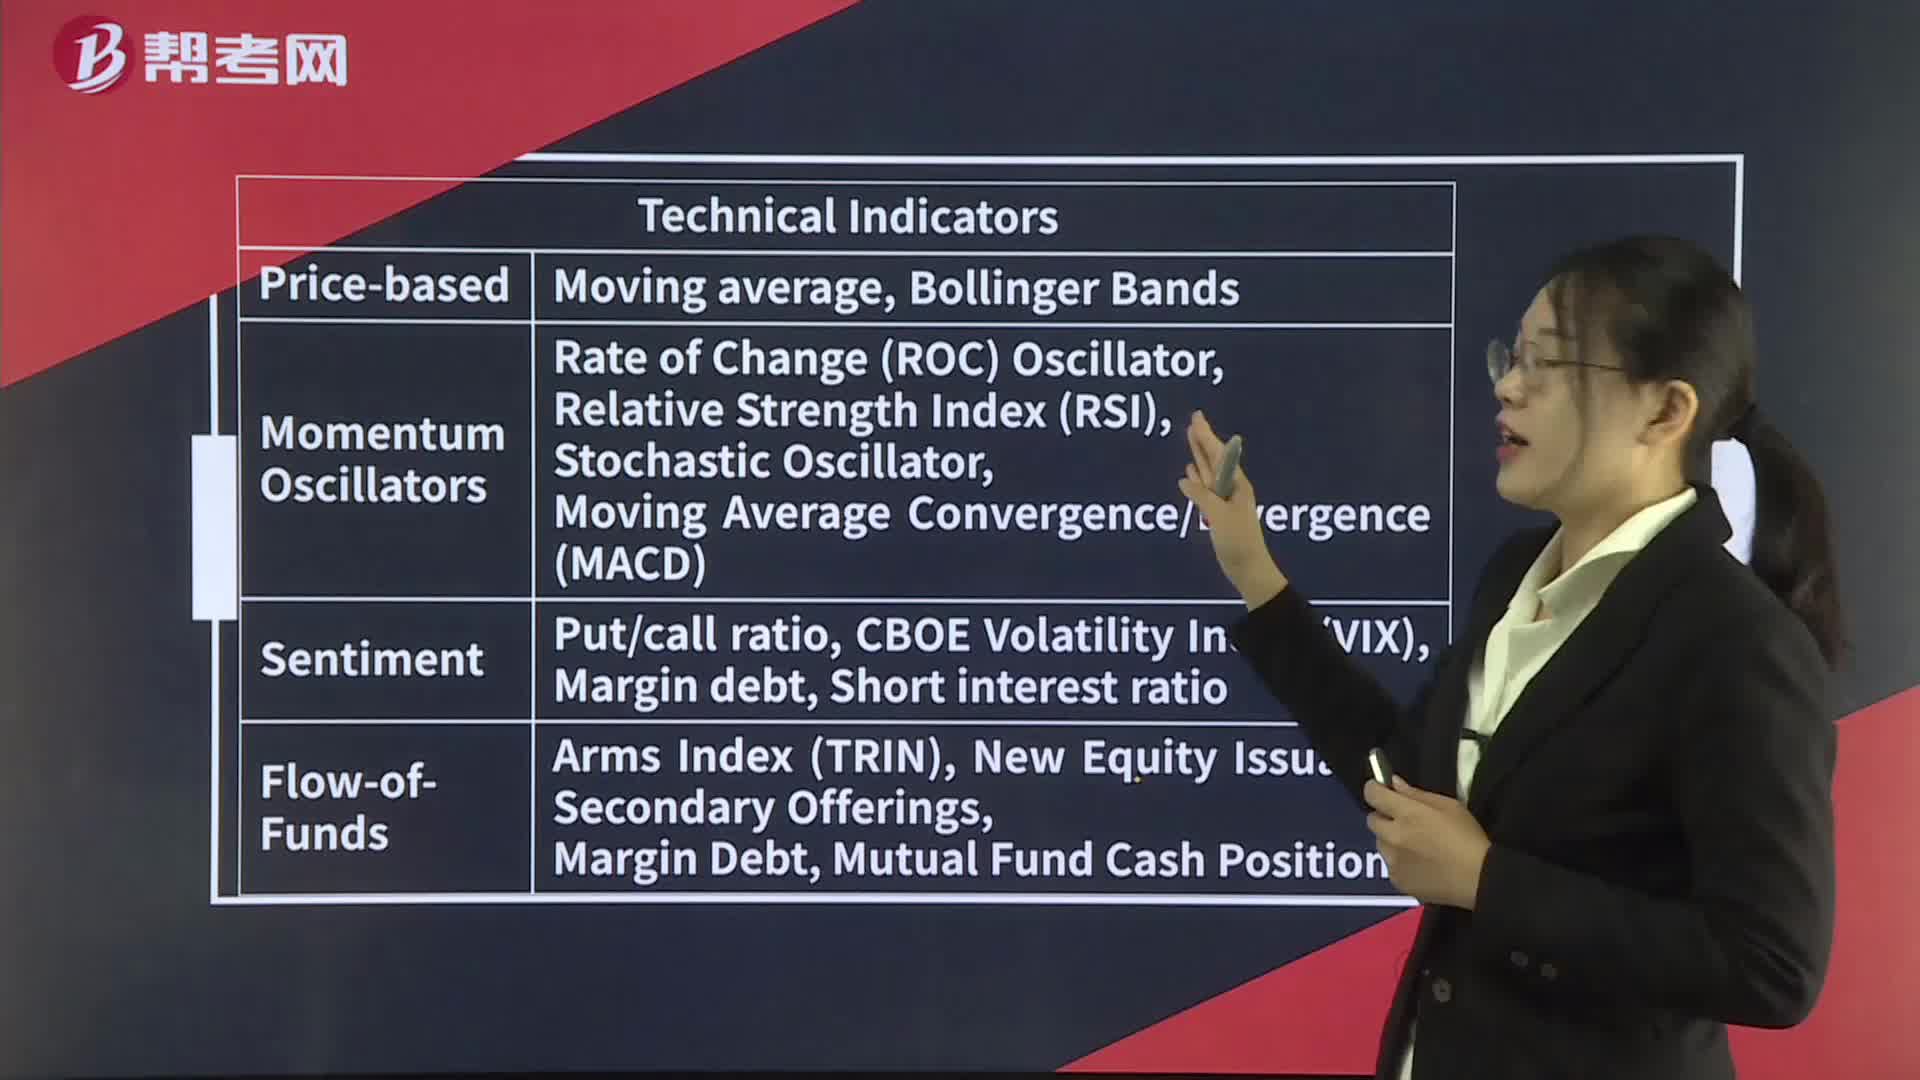
183Technical Indicators— Summary:Technical Indicators— Summary:C. a moving-average line with[Practiceconstructed so that they oscillate between a high and a low or around 0 or 100.
 328
328Technical Indicators— Sentiment indicators:Exchange.debt.Shortinterest as an indicator.
 400
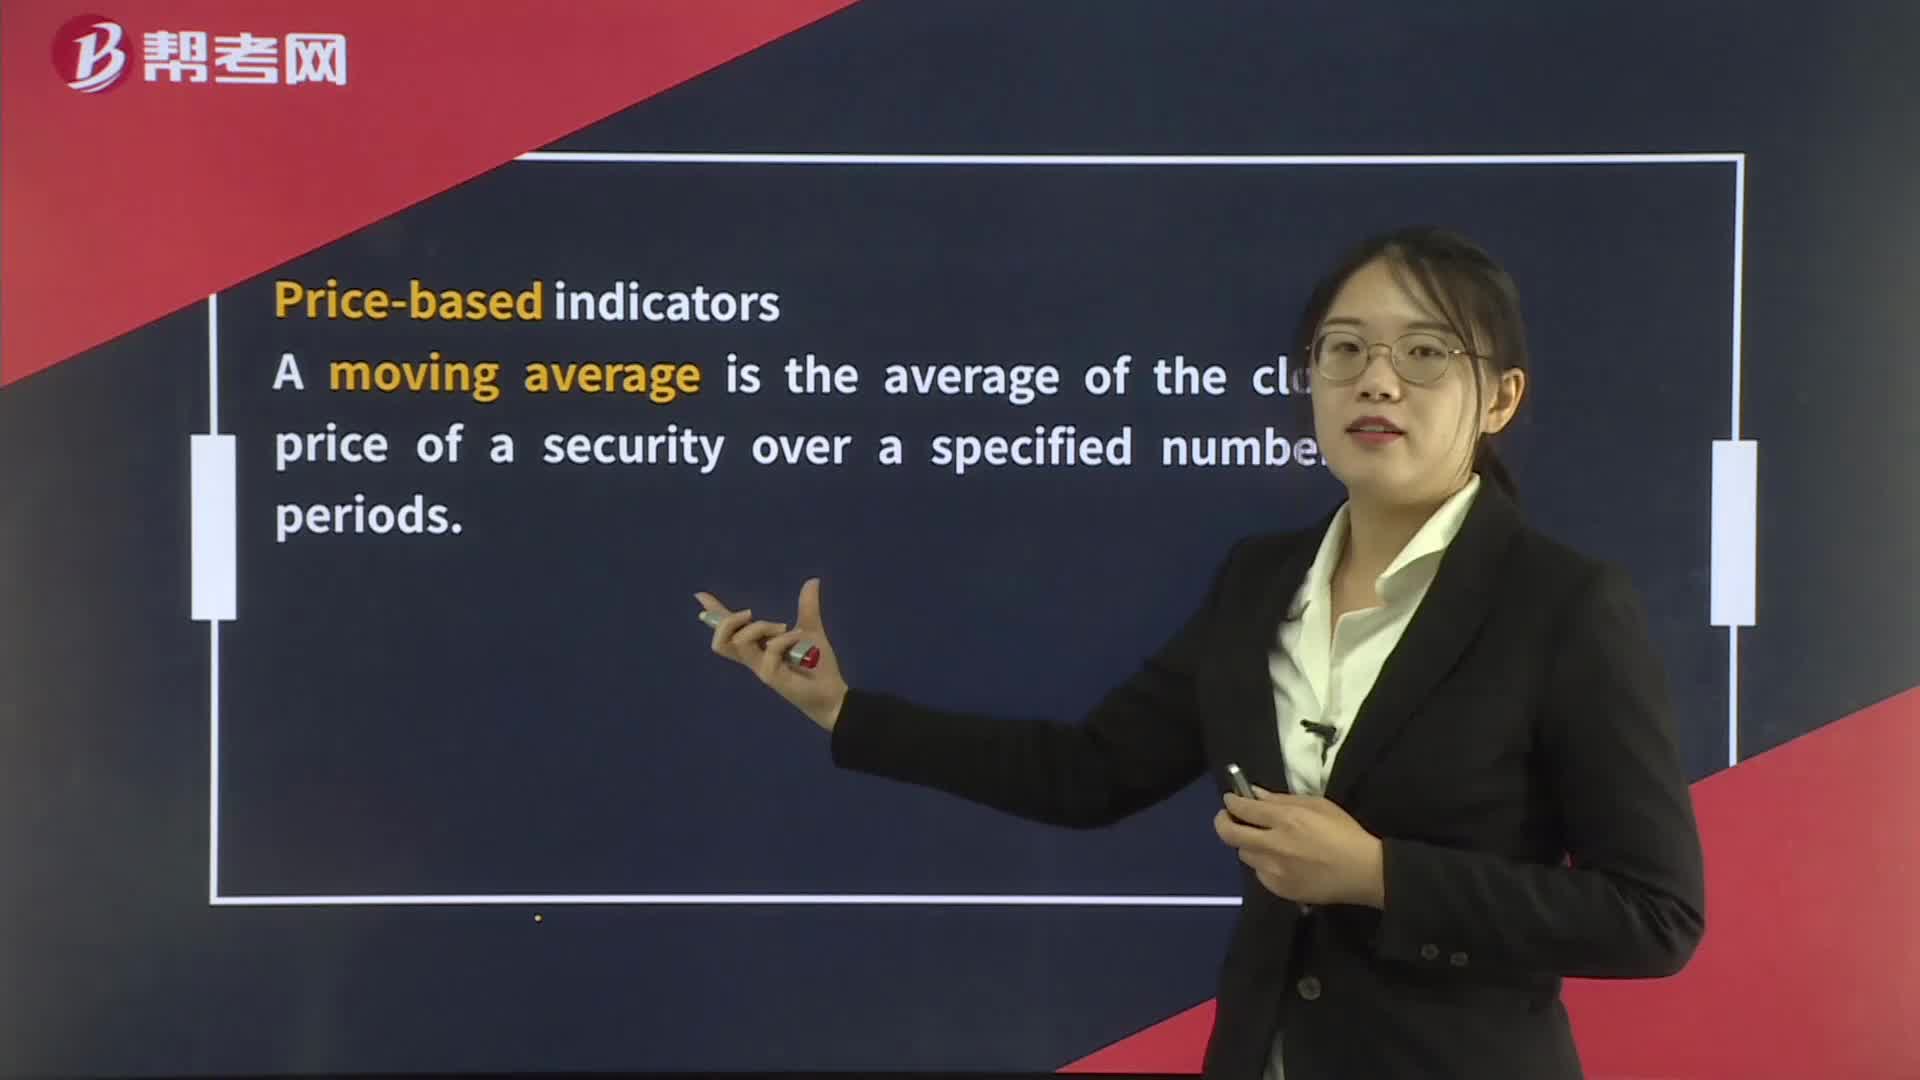
400Technical Indicators— Price-based Indicators:Simple moving average:moving-average linestrategyLong-term investors might buy on a significantthe lower band.

微信扫码关注公众号
获取更多考试热门资料