-

下载亿题库APP
-
联系电话:400-660-1360
下载亿题库APP
联系电话:400-660-1360

请谨慎保管和记忆你的密码,以免泄露和丢失
请谨慎保管和记忆你的密码,以免泄露和丢失
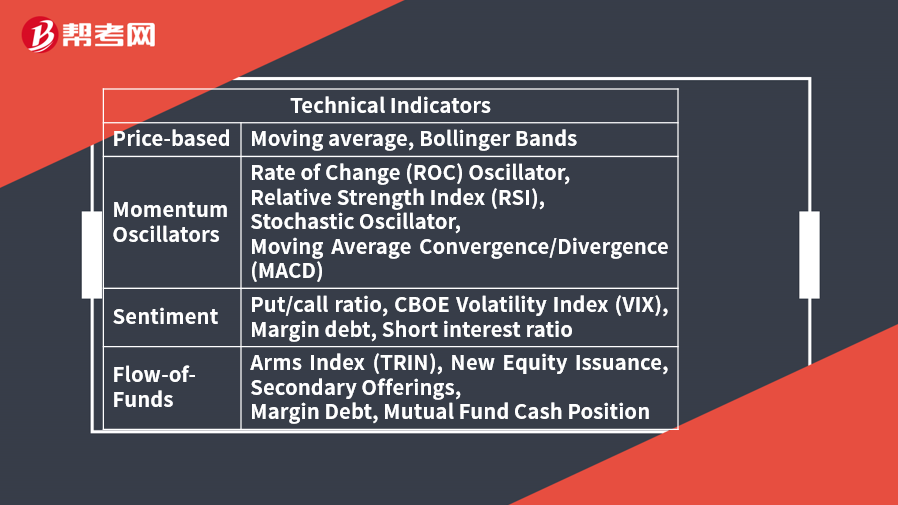
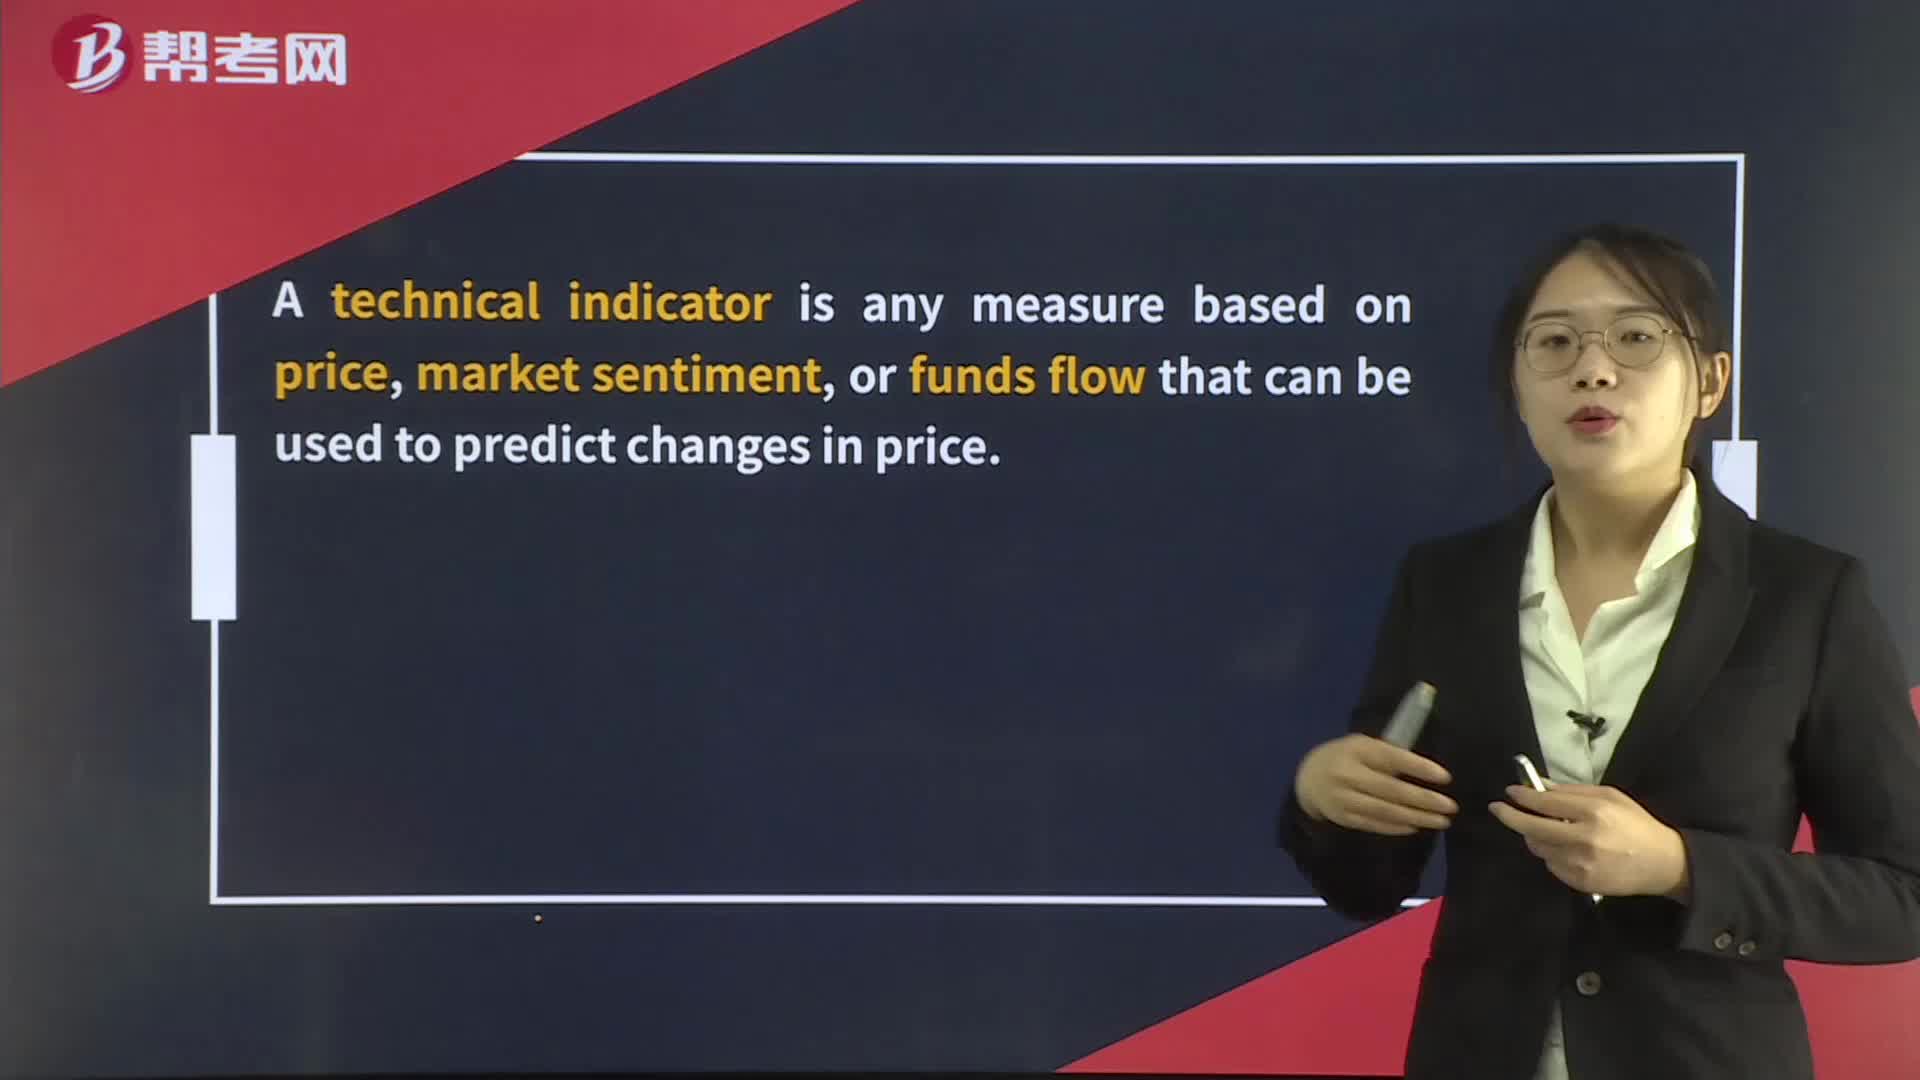
Technical Analysis Tools— Technical Indicators
A technical indicator is any measure based on price, market sentiment, or funds flow that can be used to predict changes in price.

Price-based indicators
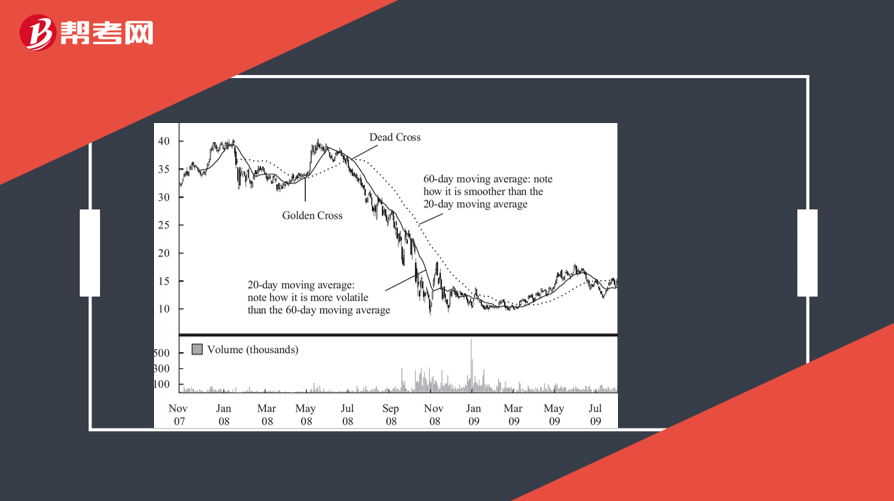
A moving average is the average of the closing price of a security over a specified number of periods.
Simple moving average: weigh each price equally in the calculation of the average price. (commonly used)
Exponential moving average (exponentially smoothed moving average): greatest weight to recent prices while giving exponentially less weight to older prices.
A security that has been trending down in price will trade below its moving average. A security that has been trending up will trade above its moving average.
Once price begins to move back up toward its moving-average line, this line can serve as a resistance level.
When a short-term moving average crosses from underneath a longer-term average, this movement is considered bullish and is termed a golden cross.
When a short-term moving average crosses from above a longer-term moving average, this movement is considered bearish and is called a dead cross.

Bollinger Bands consist of a moving average plus a higher line representing the moving average plus a set number of standard deviations from average price (for the same number of periods as used to calculate the moving average) and a lower line that is a moving average minus the same number of standard deviations.
Contrarian strategy: sell when a security price reaches the upper band and buy when it reaches the lower band.
Long-term investors might buy on a significant breakout above the upper boundary band and sell on a significant breakout below the lower band.
Momentum oscillators
Oscillators alert a trader to overbought or oversold conditions.
Three main uses of oscillators:
1 determine the strength of a trend
2 when oscillators reach historically high or low levels, they may be signaling a pending trend reversal.
3 in a non-trending market, oscillators can be used for short-term trading decisions

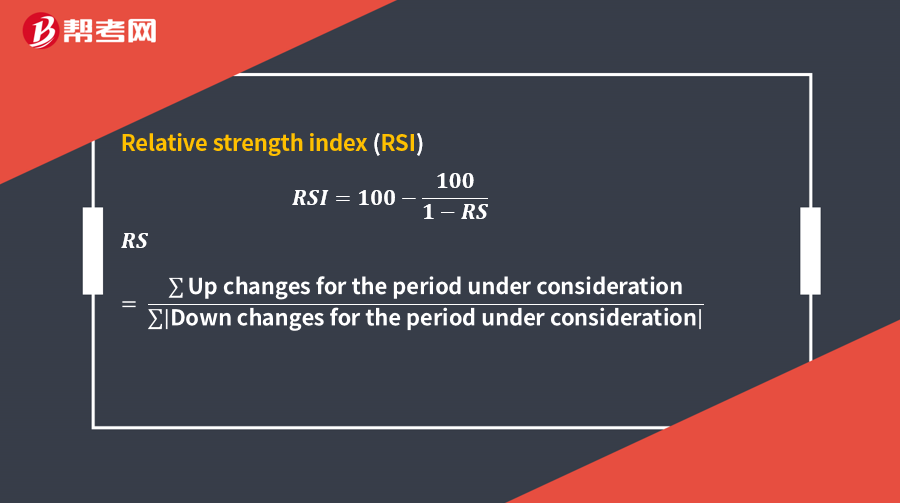
The index construction forces the RSI to lie within 0 and 100.
Values above 70 represents an overbought situation.
Values below 30 suggest the asset is oversold.
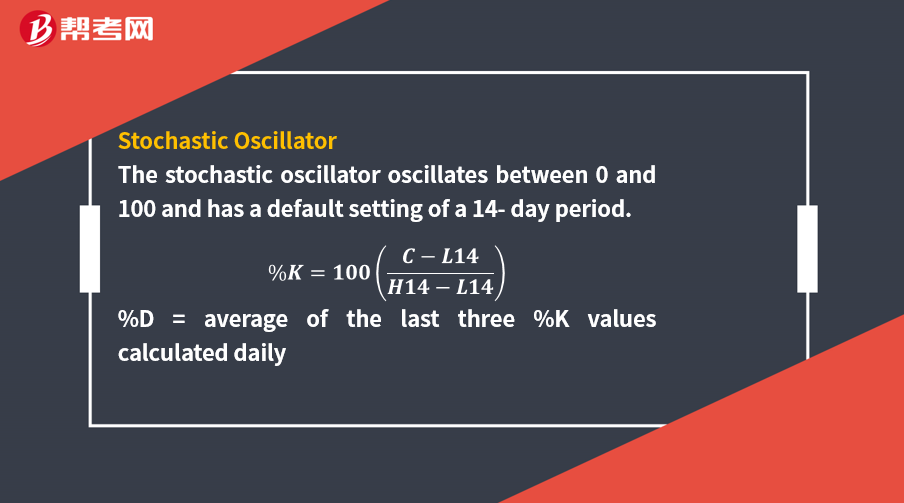
The default oversold–overbought range for the stochastic oscillator is based on reading the signal line relative to readings of 20 and 80.
The absolute level of should be considered in light of their normal range.
Movements above this range indicate an overbought security and are considered bearish; movements below this range indicate an oversold security and are considered bullish.
When the %K moves from below the %D line to above it, this move is considered a bullish short-term trading signal.
When %K moves from above the %D line to below it, this pattern is considered bearish.
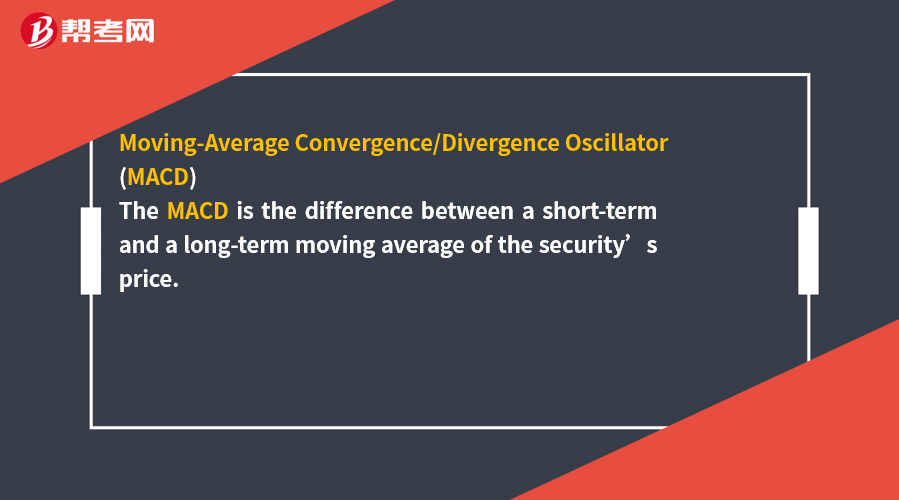
The MACD is constructed by calculating two lines,
MACD line: difference between two exponentially smoothed moving averages, generally 12 and 26 days.
Signal line: exponentially smoothed average of MACD line, generally 9 days.
Used in 3 ways: crossovers; MACD outside its normal range; use trend lines on the MACD itself
Sentiment indicators attempt to gauge investor activity for signs of increasing bullishness or bearishness.
Opinion Polls
Technicians look at prior market activity and compare it with highs or lows in sentiment, as well as inflection points in sentiment, as a gauge when they are forecasting the future direction of the market.
Put/call ratio is the volume of put options traded divided by the volume of call options traded for a particular financial instrument. Normally below 1.0. Considered contrarian indicator.
At extreme lows, market sentiment overly positive, correction is likely.
At extreme highs, market sentiment extremely negative, an increase in price is likely.
The CBOE Volatility Index (VIX) is a measure of near-term market volatility calculated by the Chicago Board Options Exchange.
The VIX rises when market participants become fearful of an impending market decline.
When other indicators suggest that the market is oversold and the VIX is at an extreme high, this combination is considered bullish.
Margin debt.
When stock margin debt is increasing, investors are aggressively buying and stock prices will move higher because of increased demand.
Rising margin debt is generally associated with a rising index level, and falling margin debt is associated with a falling index level.
Short interest.
The number of shares of a particular security that are currently sold short is called “short interest.”
Short interest ratio = Short interest/Average daily trading volume
Opinions differ about how to interpret short interest as an indicator.
Flow-of-Funds Indicators
Technicians look at fund flows as a way to gauge the potential supply and demand for equities.
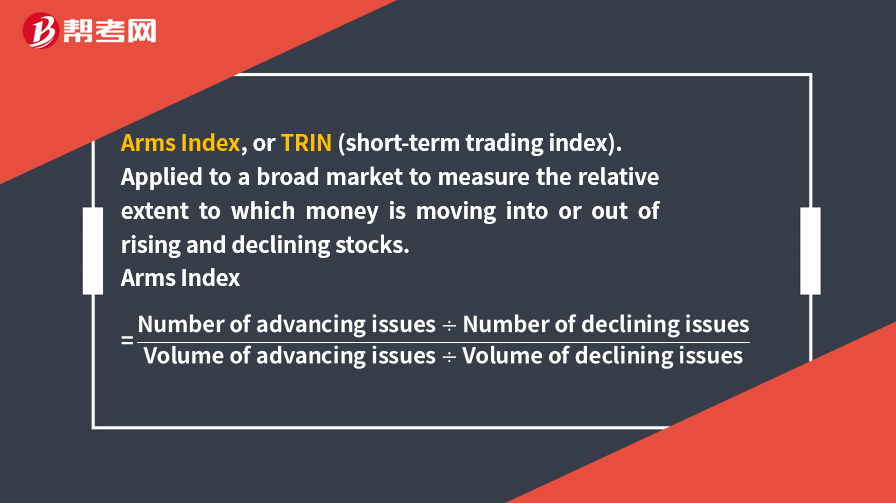
Arms index near 1.0, the market is in balance.
A value above 1.0 means that there is more volume in declining stocks; a value below 1.0 means that most trading activity is in rising stocks.
Margin debt is also widely used as a flow-of-funds indicator because margin loans may increase the purchases of stocks and declining margin balances may force the selling of stocks.
Mutual Fund Cash Position
Contrarian indicator.
The average year-end mutual fund cash in the US as a percentage of assets from 1984 through 2008 was 6.8 percent.
New Equity Issuance
The new equity issuance indicator suggests that as the number of initial public offerings (IPOs) increases, the upward price trend may be about to turn down.
Premium prices occur near market tops.
IPOs increase the aggregate supply of shares available for investors to purchase.
Secondary Offerings
From a market perspective, secondary offerings of shares have the potential to change the supply-and-demand equation as much as IPOs do.
[Practice Problems] Bollinger Bands are constructed by plotting:
A. a MACD line and a signal line.
B. a moving-average line with an uptrend line above and downtrend line below.
C. a moving-average line with upper and lower lines that are at a set number of standard deviations apart.
[Solutions] C
Bollinger Bands consist of a moving average and a higher line representing the moving average plus a set number of standard deviations from average price (for the same number of periods as used to calculate the moving average) and a lower line that is a moving average minus the same number of standard deviations.
[Practice Problems] Which of the following is not a momentum oscillator?
A. MACD.
B. Stochastic oscillator.
C. Bollinger Bands.
[Solutions] C
Bollinger Bands are price-based indicators, not momentum oscillators, which are constructed so that they oscillate between a high and a low or around 0 or 100.
 241
241
Technical Analysis Tools— Trend:line,draw a line connecting the highs of the price chart.:price.[PracticeLtd.Change
 18
18
Technical Analysis Tools— Technical Indicators:changes in price.
 589
589
Technical Analysis Tools— Charts:Bar,First,size.,Box,meaning.?scalee.g.[Practice
 08:39
08:39
2020-05-18
 04:30
04:30
 13:18
13:18
 13:11
13:11
 06:13
06:13
2020-05-15

微信扫码关注公众号
获取更多考试热门资料