下载亿题库APP
联系电话:400-660-1360
下载亿题库APP
联系电话:400-660-1360

请谨慎保管和记忆你的密码,以免泄露和丢失
请谨慎保管和记忆你的密码,以免泄露和丢失
Technical Analysis Tools— Trend
An uptrend for a security is when the price goes to higher highs and higher lows.
A downtrend is when a security makes lower lows and lower highs.
To draw an uptrend line, draw a line connecting the lows of the price chart.
To draw a downtrend line, draw a line connecting the highs of the price chart.
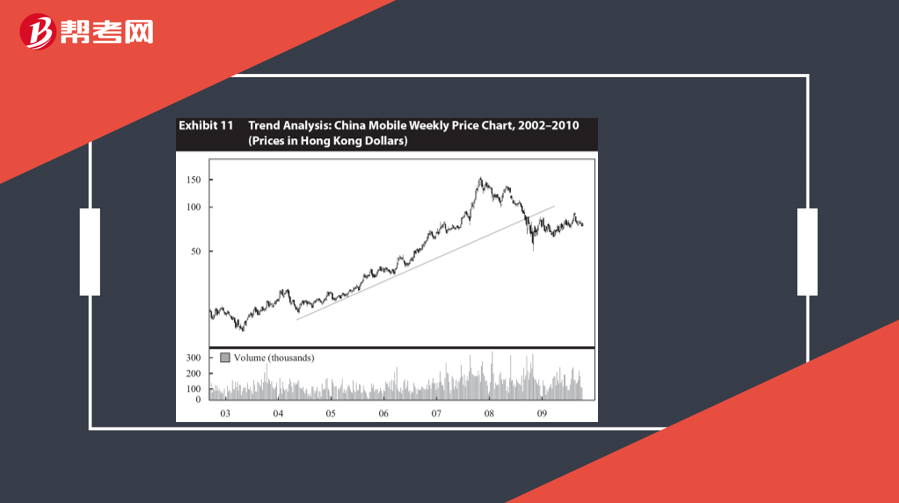
Major breakdowns through or below the uptrend line (e.g., 5–10 percent) indicate that the uptrend is over and may signal a further decline in the price.
Major breakouts above the downtrend line (e.g., 5–10 percent) indicate that the downtrend is over and a rise in the security’s price may occur.
[Practice Problems] The exhibit depicts GreatWall Information Industry Co., Ltd., ordinary shares, traded on the Shenzhen Stock Exchange, for late 2008 through late 2009 in renminbi (RMB). The uptrend was most likely broken at a price level nearest to:
7 RMB.
8.5 RMB.
10 RMB.
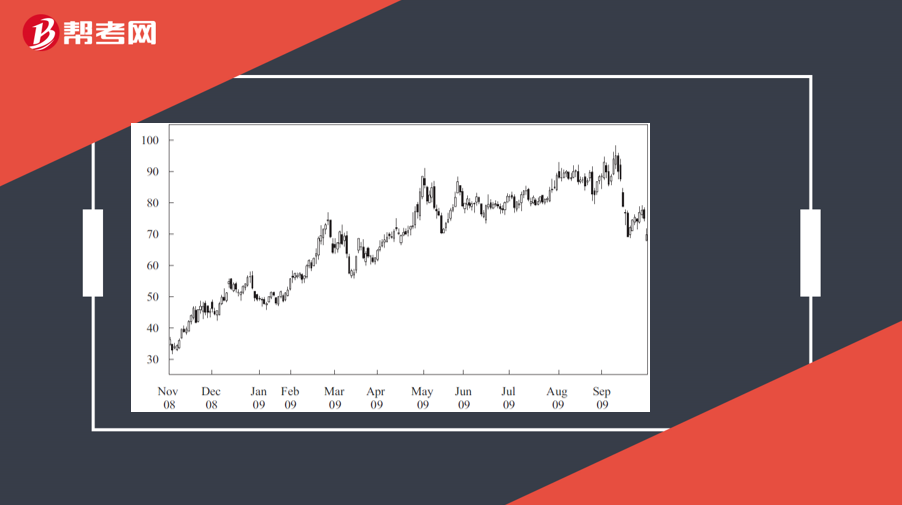
[Solutions] B
Share price breaks through trend line at approximately RMB 8.5
Support is a low price range in which buying activity is sufficient to stop the decline in price.
Resistance is a price range in which selling is sufficient to stop the rise in price.
Change in polarity principle states that once a support level is breached, it becomes a resistance level.
 241
241Technical Analysis Tools— Trend:line,draw a line connecting the highs of the price chart.:price.[PracticeLtd.Change
 18
18Technical Analysis Tools— Technical Indicators:changes in price.
 589
589Technical Analysis Tools— Charts:Bar,First,size.,Box,meaning.?scalee.g.[Practice

微信扫码关注公众号
获取更多考试热门资料