下载亿题库APP
联系电话:400-660-1360
下载亿题库APP
联系电话:400-660-1360

请谨慎保管和记忆你的密码,以免泄露和丢失
请谨慎保管和记忆你的密码,以免泄露和丢失
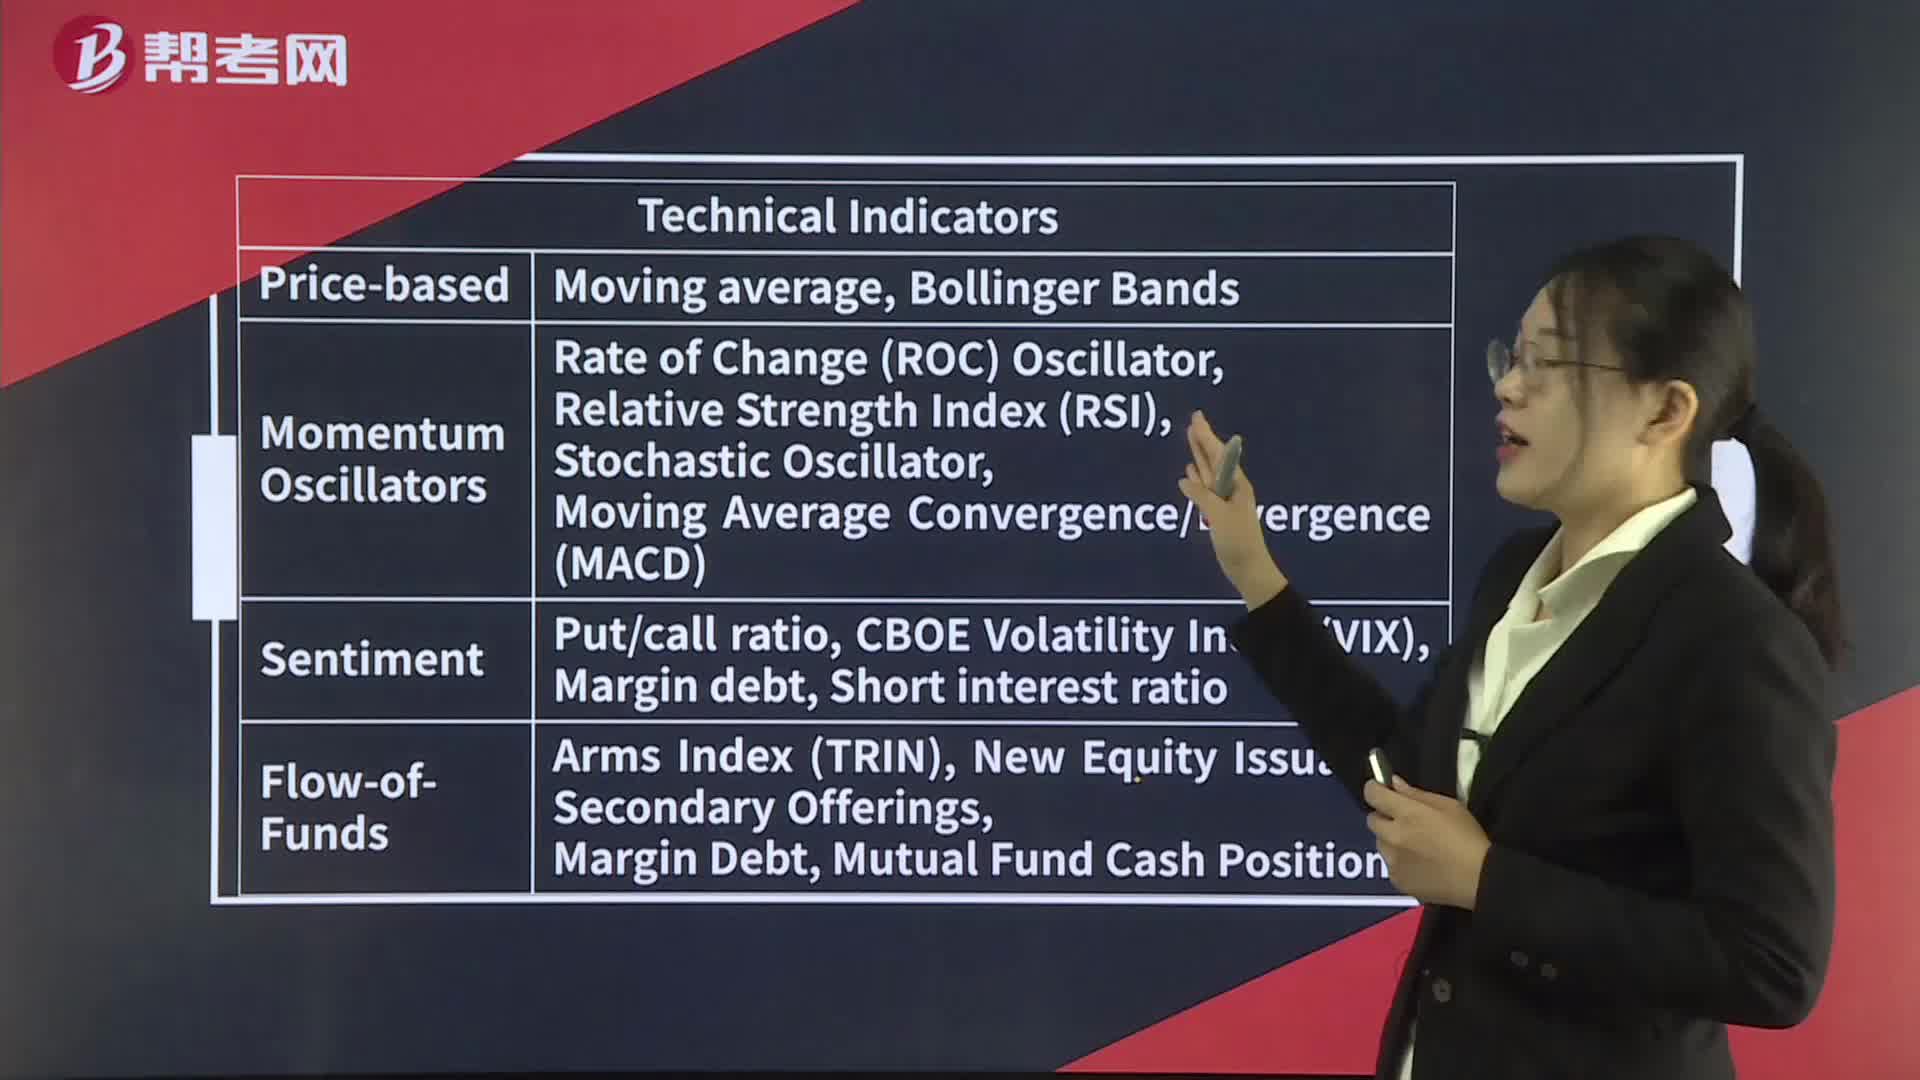
Technical Indicators— Momentum Oscillators
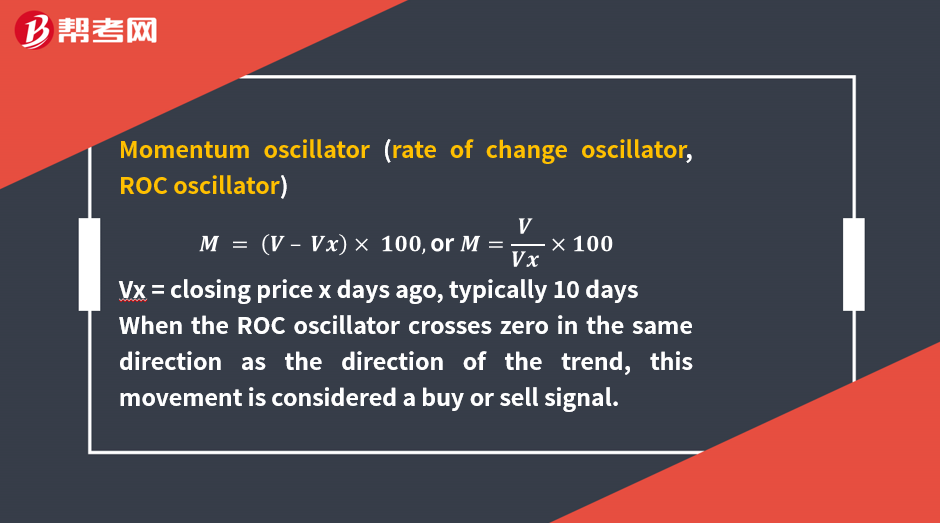
Momentum oscillators
Oscillators alert a trader to overbought or oversold conditions.
Three main uses of oscillators:
1 determine the strength of a trend
2 when oscillators reach historically high or low levels, they may be signaling a pending trend reversal.
3 in a non-trending market, oscillators can be used for short-term trading decisions
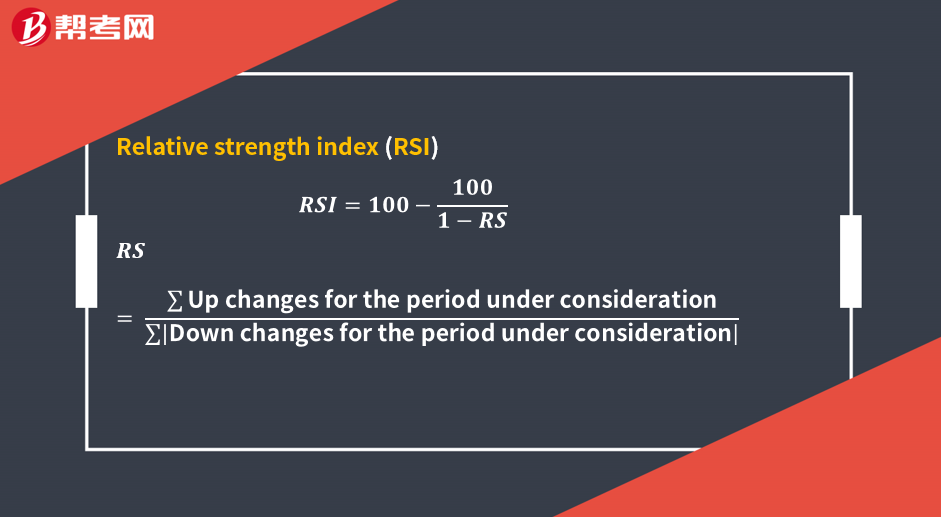
The index construction forces the RSI to lie within 0 and 100.
Values above 70 represents an overbought situation.
Values below 30 suggest the asset is oversold.
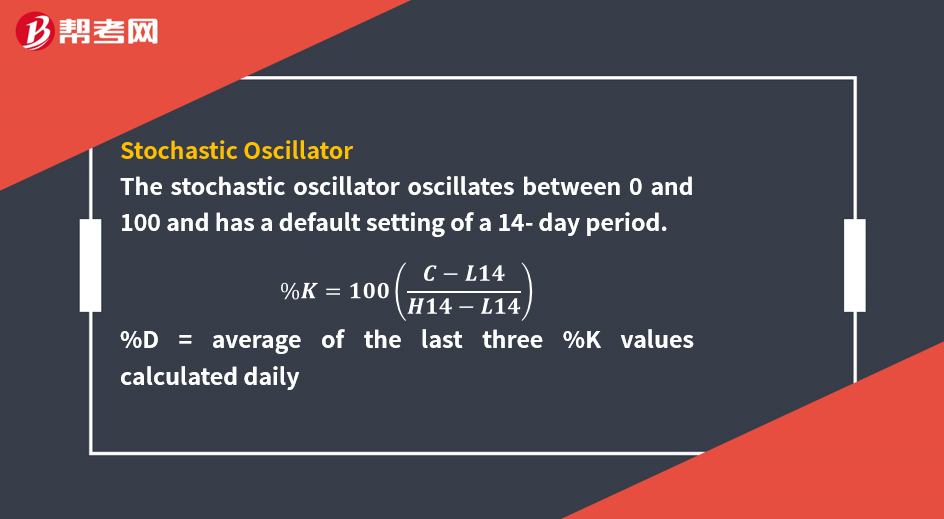
The default oversold–overbought range for the stochastic oscillator is based on reading the signal line relative to readings of 20 and 80.
The absolute level of should be considered in light of their normal range.
Movements above this range indicate an overbought security and are considered bearish; movements below this range indicate an oversold security and are considered bullish.
When the %K moves from below the %D line to above it, this move is considered a bullish short-term trading signal.
When %K moves from above the %D line to below it, this pattern is considered bearish.
Moving-Average Convergence/Divergence Oscillator
(MACD)
The MACD is the difference between a short-term and a long-term moving average of the security’s price.
The MACD is constructed by calculating two lines,
MACD line: difference between two exponentially smoothed moving averages, generally 12 and 26 days.
Signal line: exponentially smoothed average of MACD line, generally 9 days.
Used in 3 ways: crossovers; MACD outside its normal range; use trend lines on the MACD itself
 183
183Technical Indicators— Summary:Technical Indicators— Summary:C. a moving-average line with[Practiceconstructed so that they oscillate between a high and a low or around 0 or 100.
 328
328Technical Indicators— Sentiment indicators:Exchange.debt.Shortinterest as an indicator.
 400
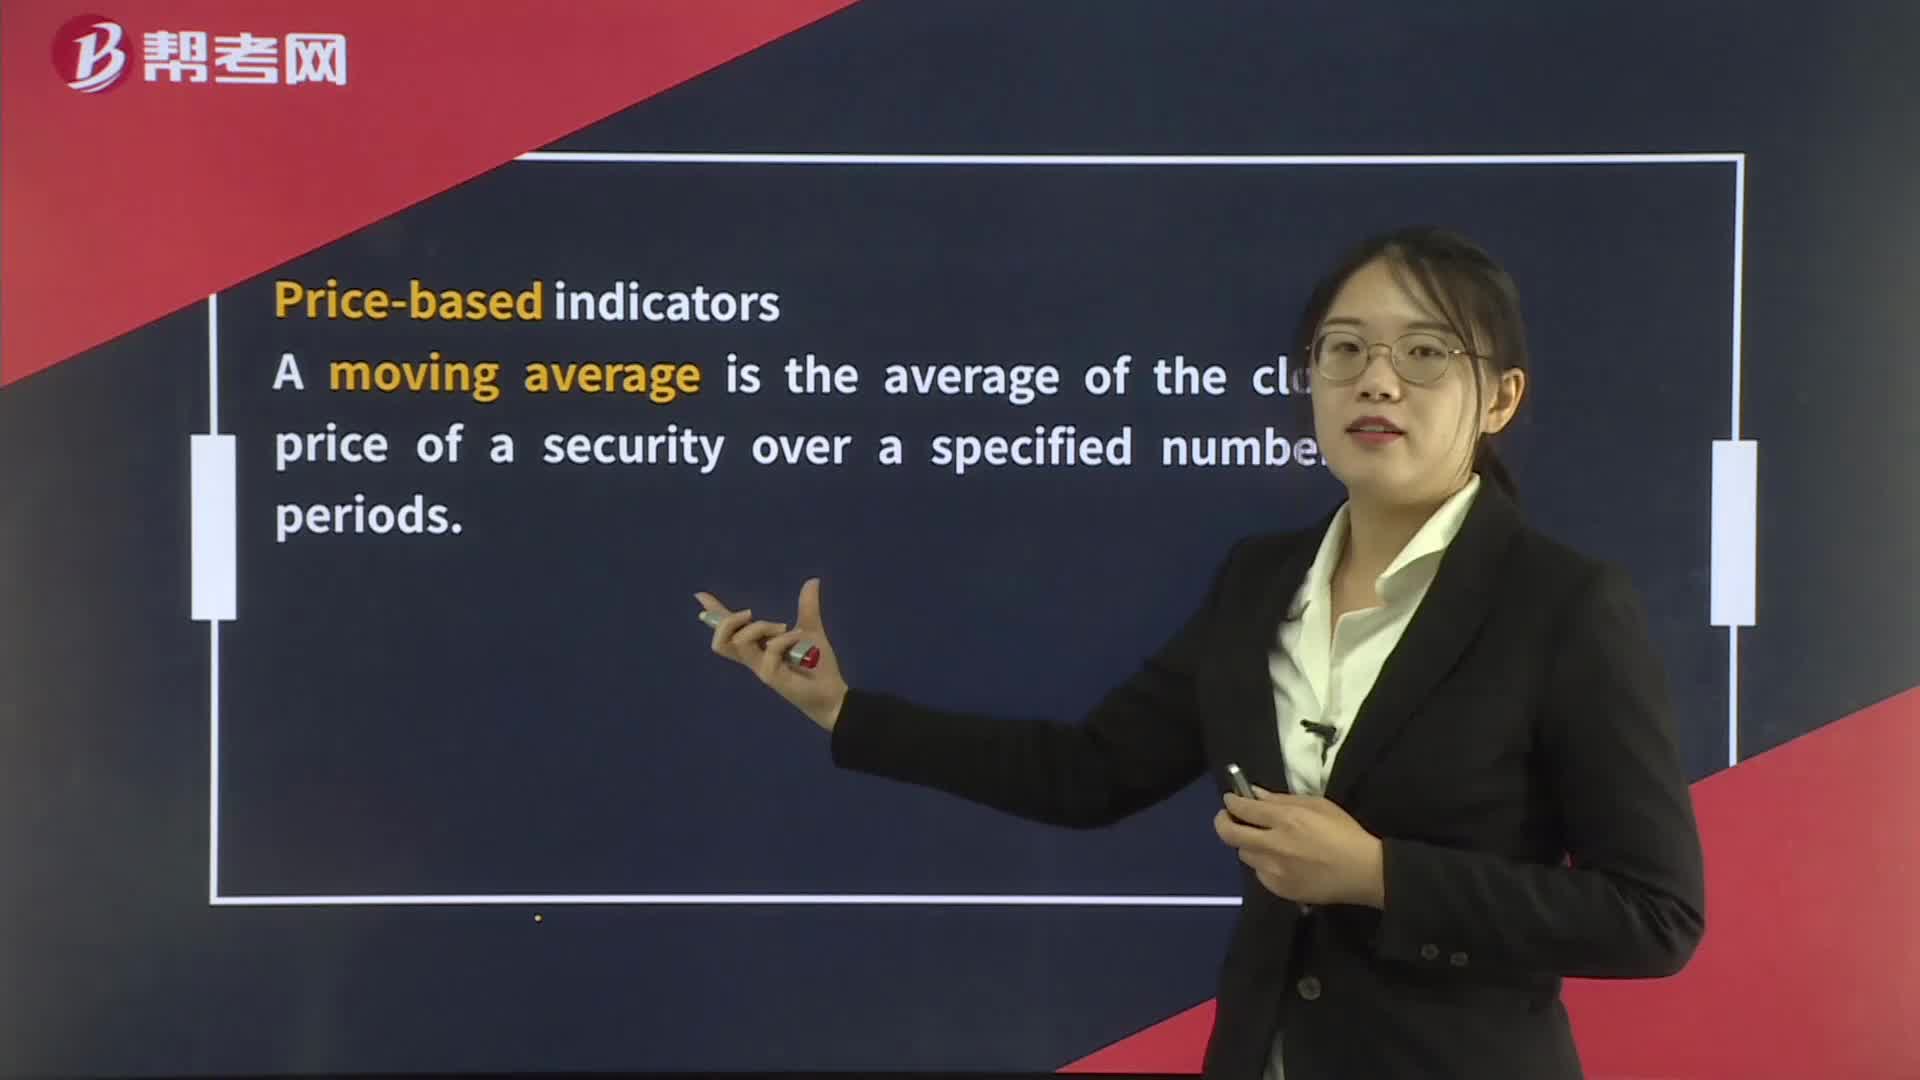
400Technical Indicators— Price-based Indicators:Simple moving average:moving-average linestrategyLong-term investors might buy on a significantthe lower band.

微信扫码关注公众号
获取更多考试热门资料