下载亿题库APP
联系电话:400-660-1360
下载亿题库APP
联系电话:400-660-1360

请谨慎保管和记忆你的密码,以免泄露和丢失
请谨慎保管和记忆你的密码,以免泄露和丢失
Point and Interval Estimates of the Population Mean
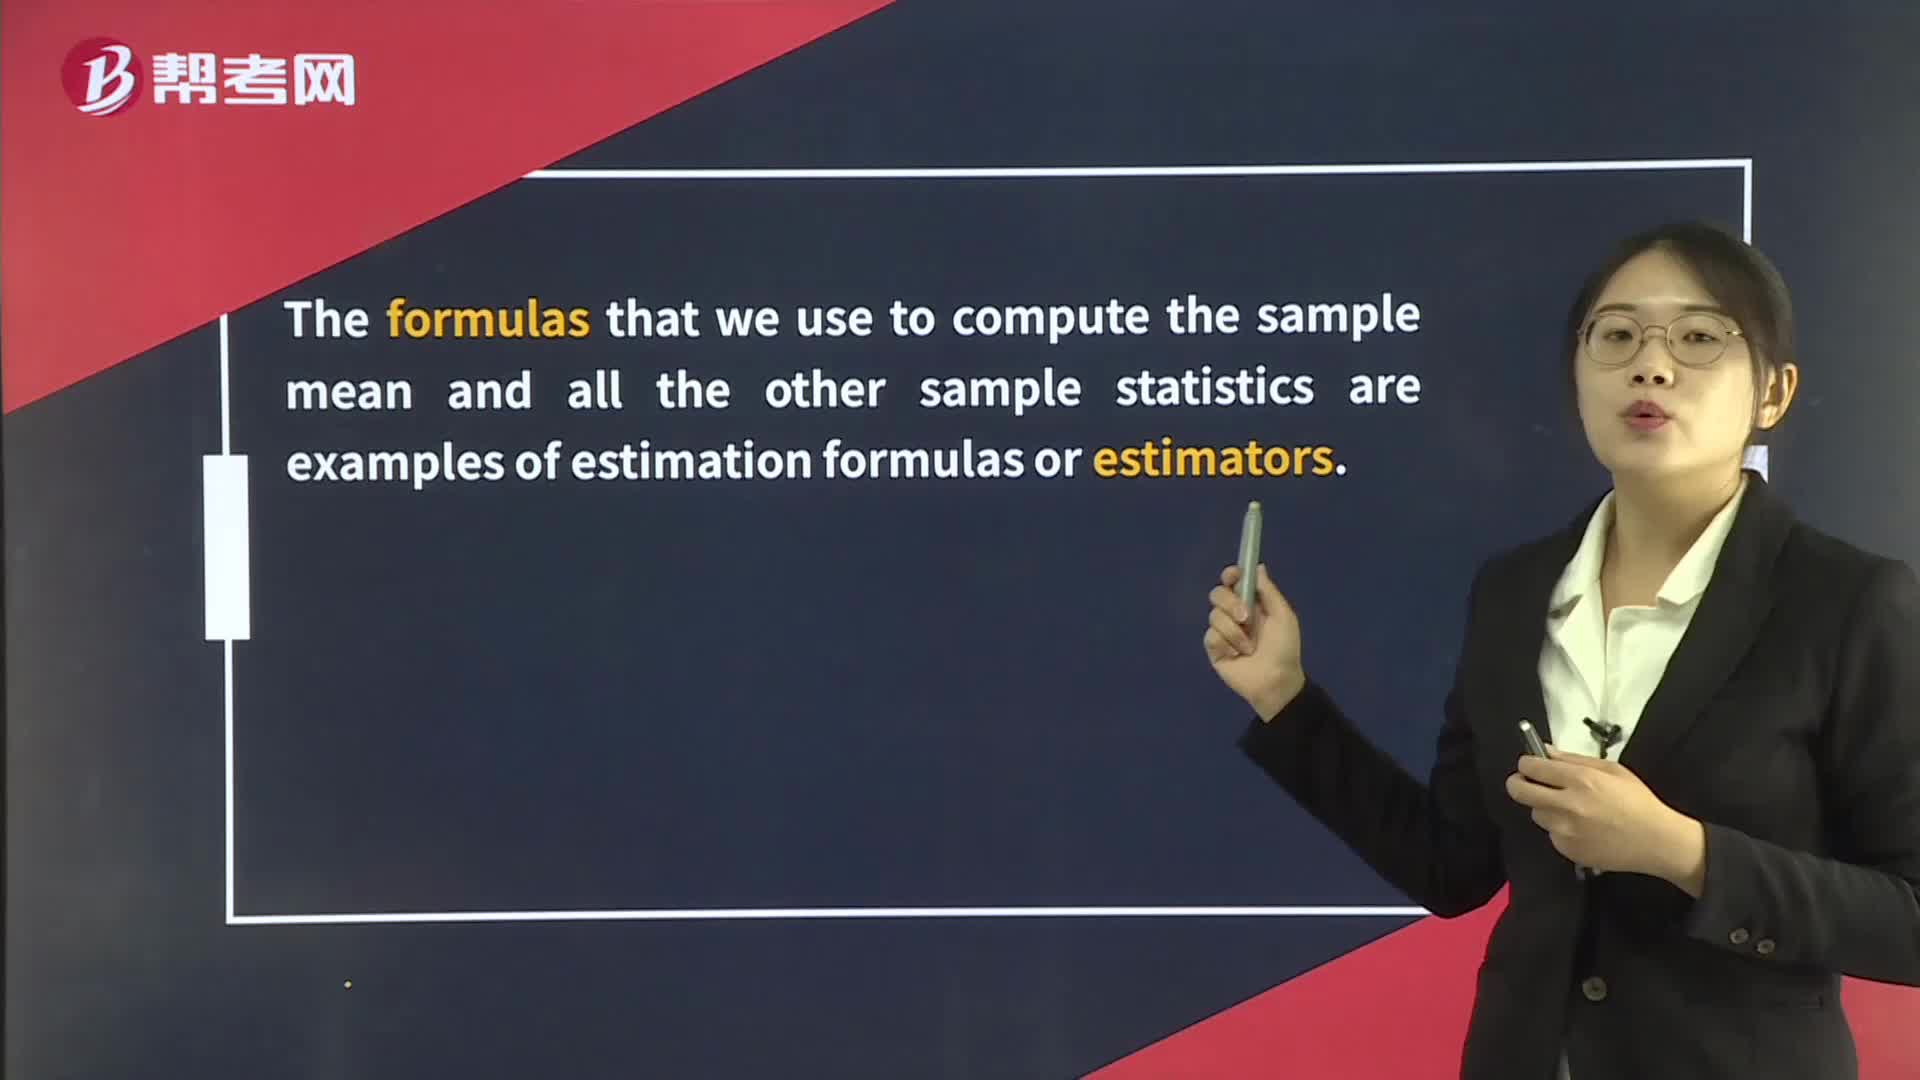
The formulas that we use to compute the sample mean and all the other sample statistics are examples of estimation formulas or estimators.
The particular value that we calculate from sample observations using an estimator is called an estimate.
An estimator has a sampling distribution; an estimate is a fixed number pertaining to a given sample and thus has no sampling distribution.
The calculated value of the sample mean in a given sample, used as an estimate of the population mean, is called a point estimate of the population mean.
Three desirable properties of estimators:
Unbiasedness.
An unbiased estimator is one whose expected value equals the parameter it is intended to estimate.
Efficiency.
An unbiased estimator is efficient if no other unbiased estimator of the same parameter has a sampling distribution with smaller variance.
[Practice Problems] If an estimator is consistent, an increase in sample size will increase the:
A. accuracy of estimates.
B. efficiency of the estimator.
C. unbiasedness of the estimator.
[Solutions] A
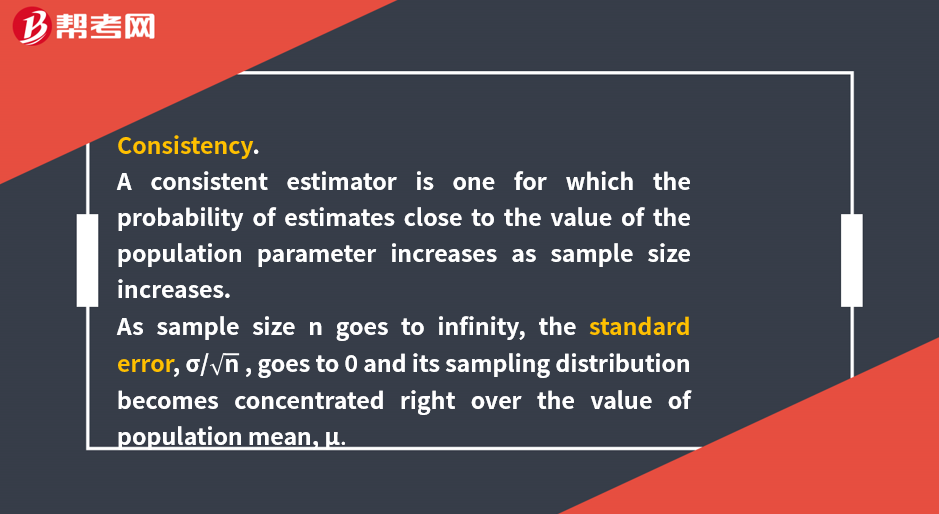
A consistent estimator is one for which the probability of estimates close to the value of the population parameter increases as sample size increases. More specifically, a consistent estimator’s sampling distribution becomes concentrated on the value of the parameter it is intended to estimate as the sample size approaches infinity.
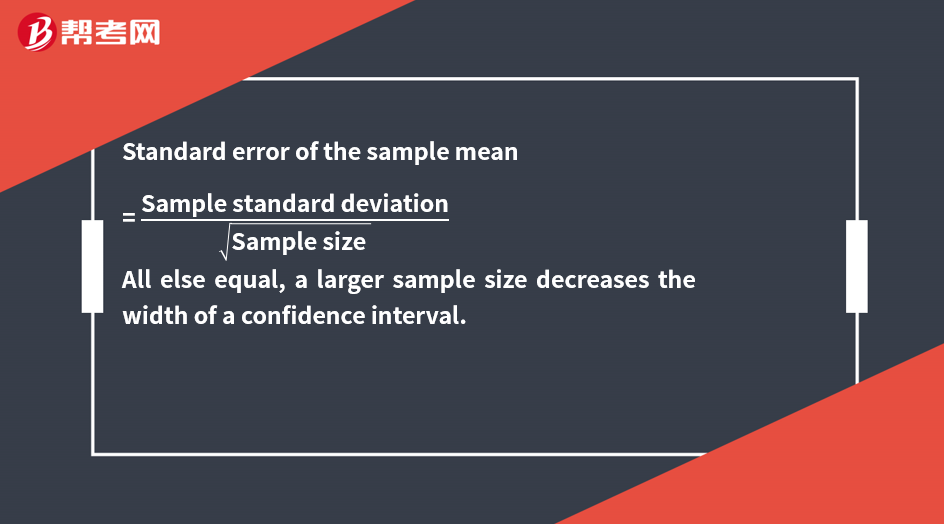
Because of sampling error, the point estimate is not likely to equal the population parameter in any given sample.
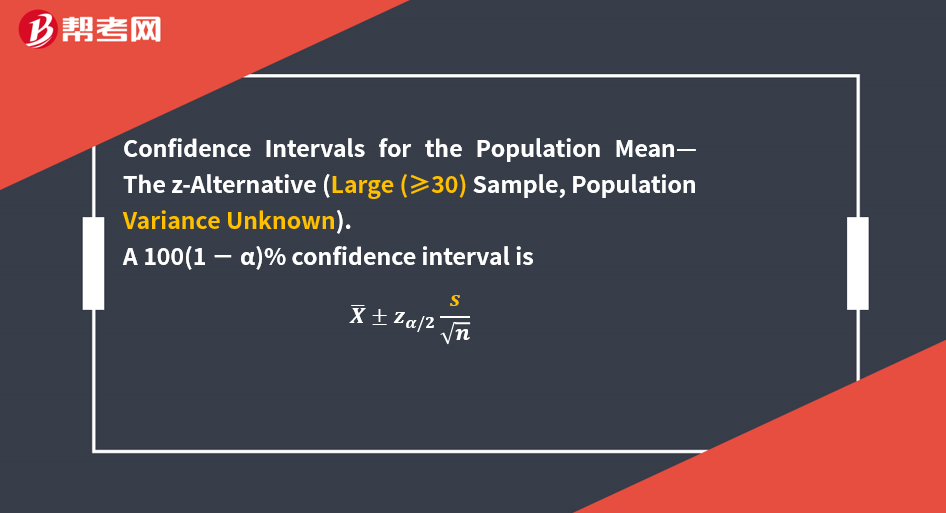
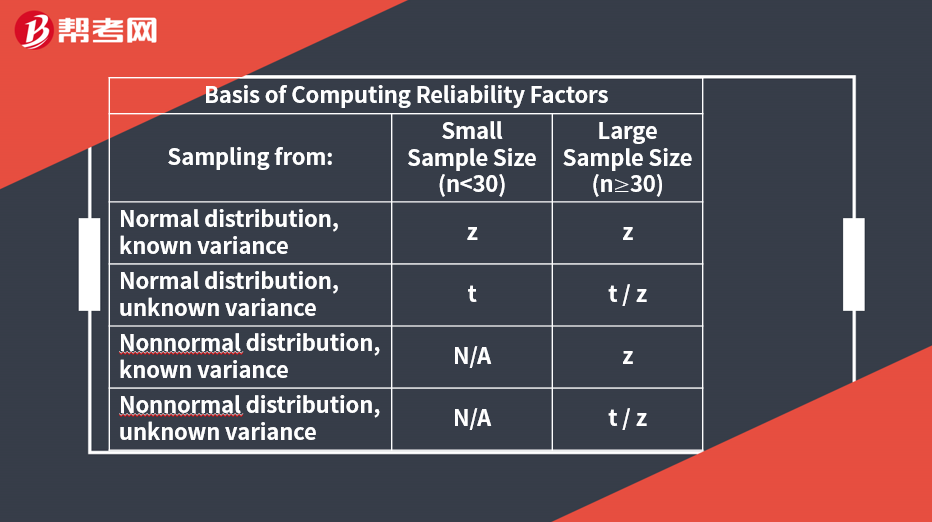
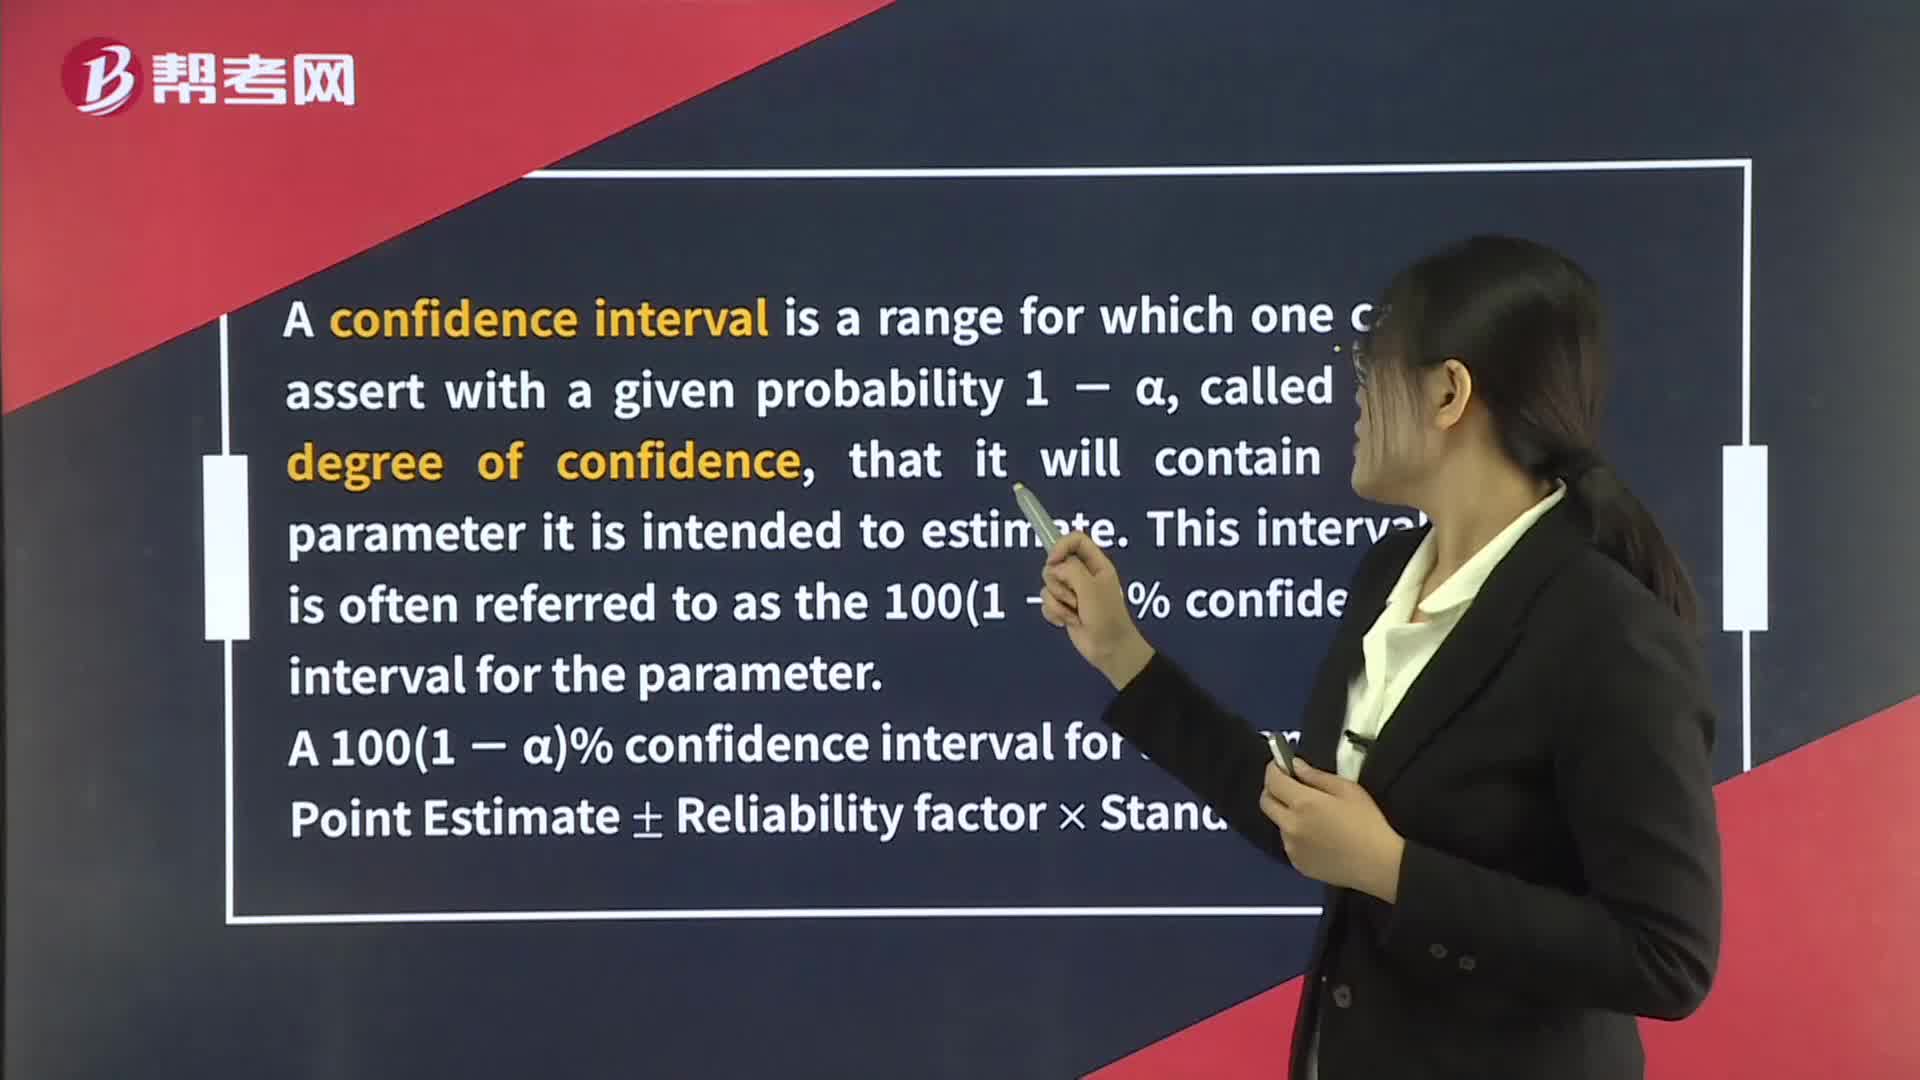
A confidence interval is a range for which one can assert with a given probability 1 − α, called the degree of confidence, that it will contain the parameter it is intended to estimate. This interval is often referred to as the 100(1 − α)% confidence interval for the parameter.
A 100(1 − α)% confidence interval for a parameter:Point Estimate ± ![]() Reliability factor×Standard error
Reliability factor×Standard error

90 percent confidence intervals: Use z0.05 = 1.65
95 percent confidence intervals: Use z0.025 = 1.96
99 percent confidence intervals: Use z0.005 = 2.58
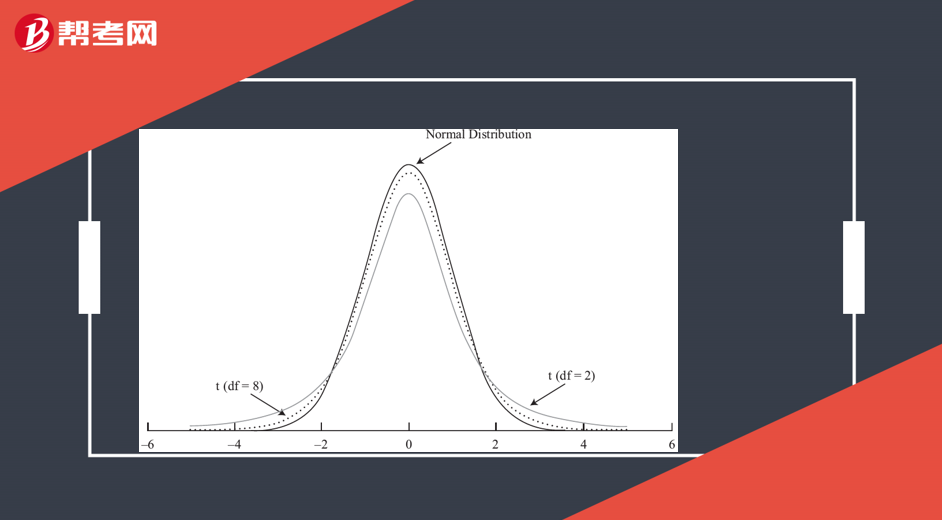
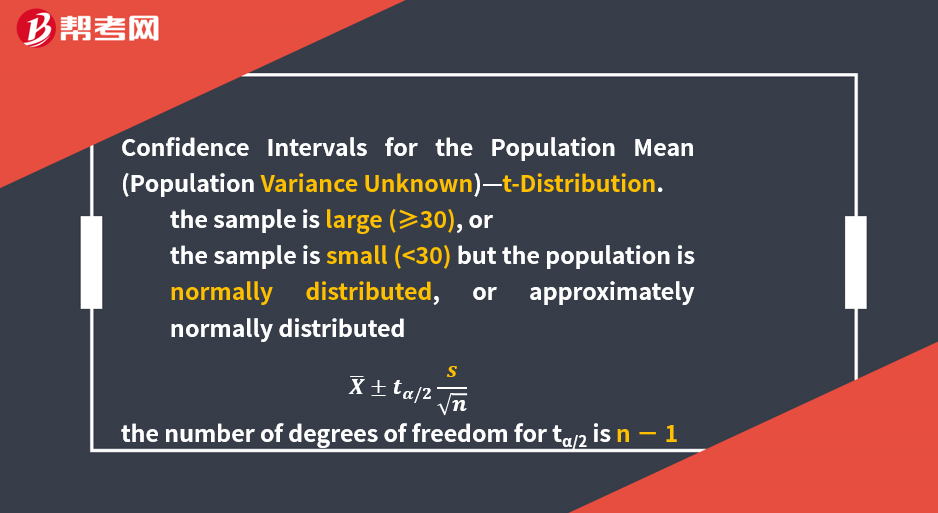
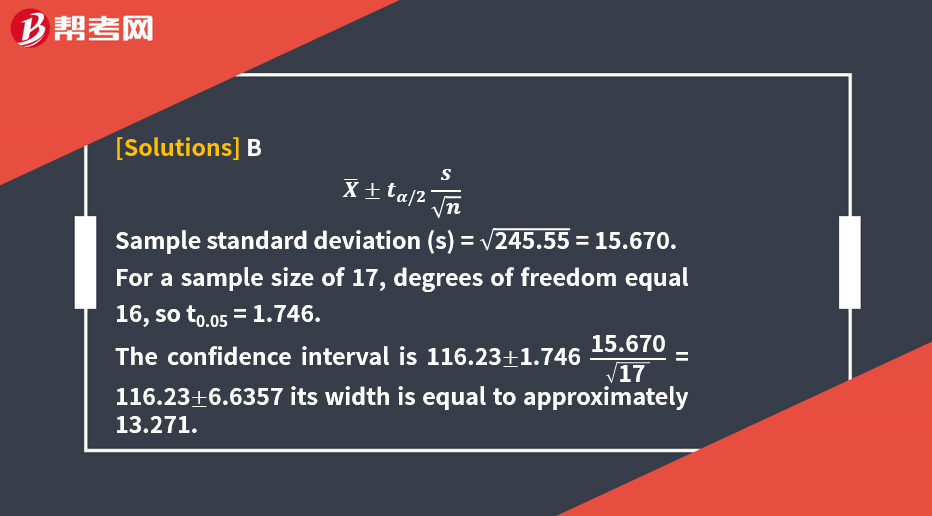
The t-distribution is a symmetrical probability distribution defined by a single parameter degrees of freedom (df).
Symmetrically distributed around its mean value of zero.
df = n − 1
Fatter tails.
As the df increase, approach the standard normal.
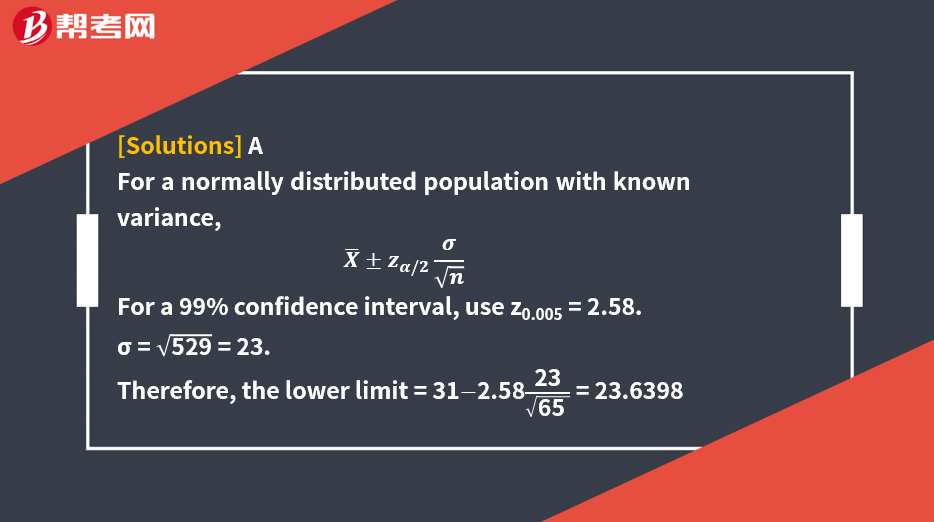
[Practice Problems] For a sample size of 65 with a mean of 31 taken from a normally distributed population with a variance of 529, a 99% confidence interval for the population mean will have a lower limit closest to:
A. 23.64.
B. 25.41.
C. 30.09.

 191
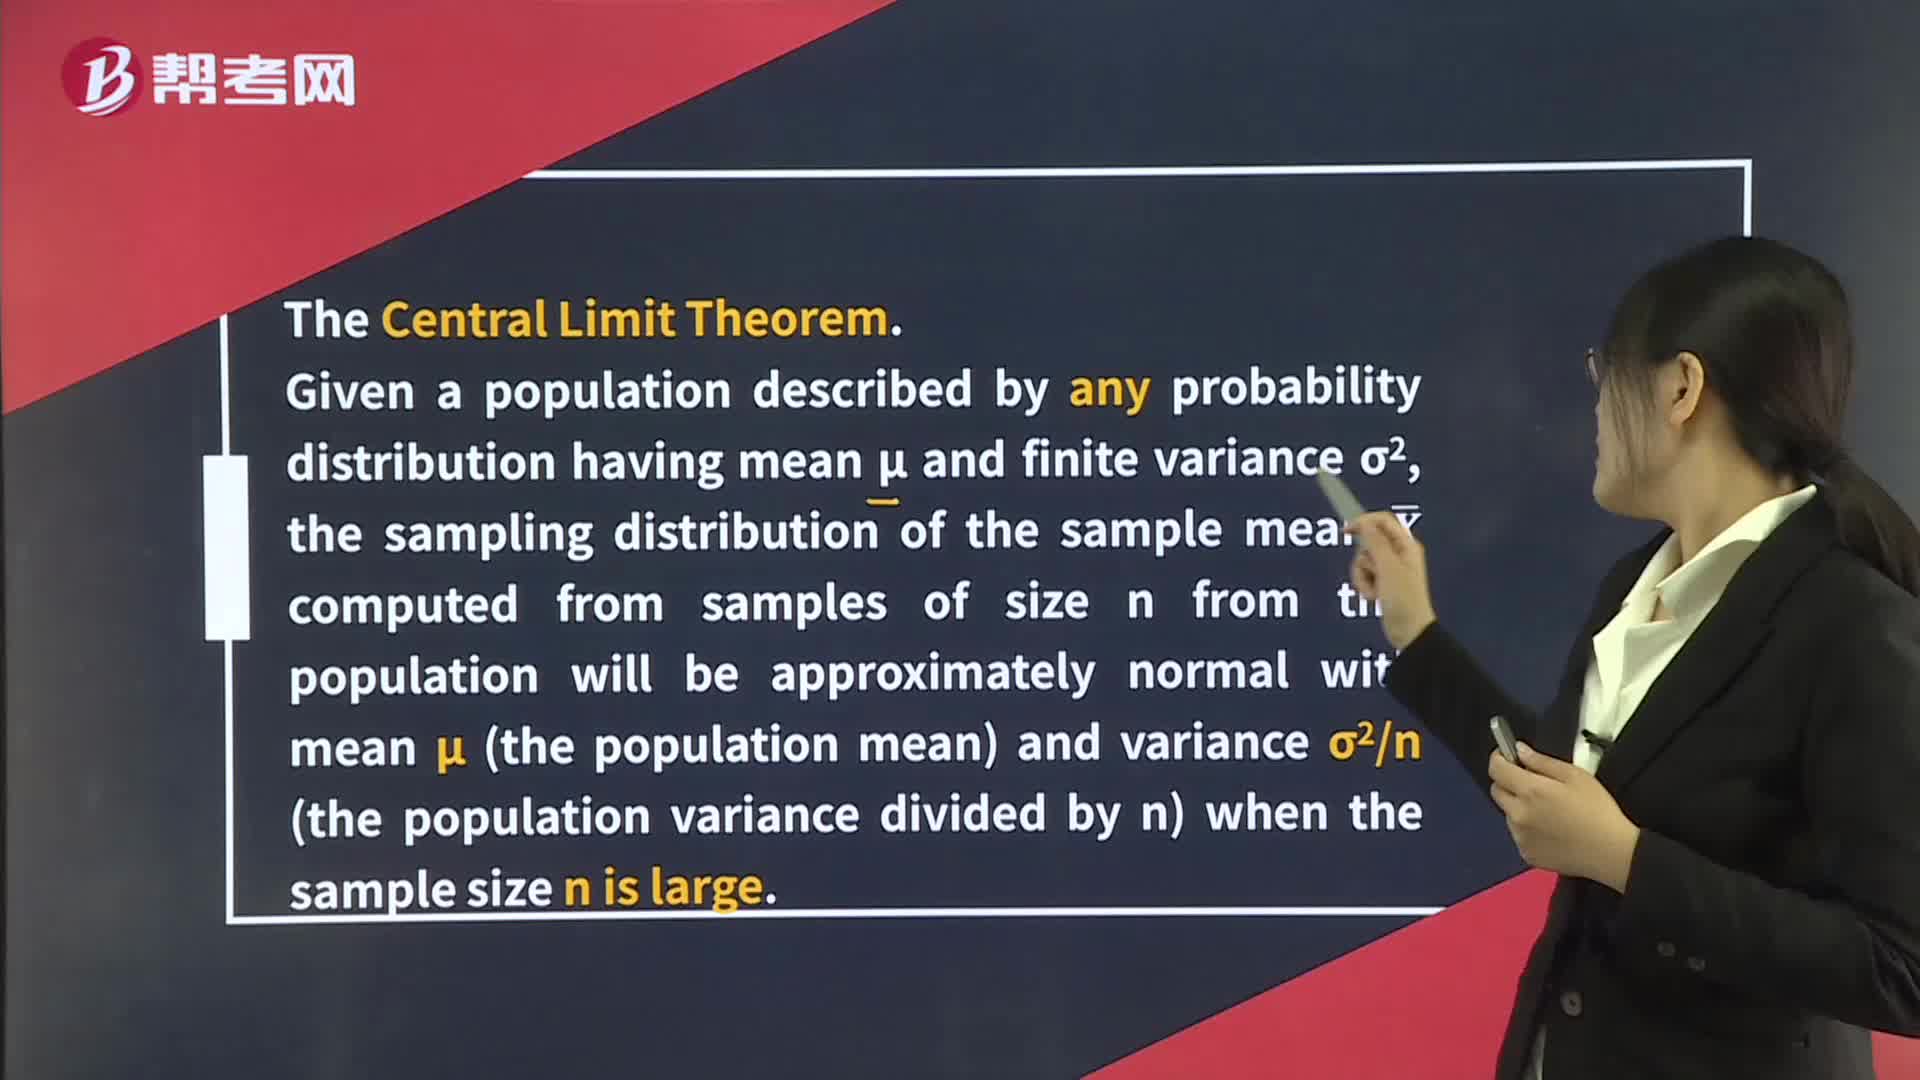
191Distribution of the Sample Mean:[Practicewhen the sample size is large.
 680
680Confidence Intervals for the Population Mean:error,A confidence:Unknown.normal.Population Variance Unknown—t-Distribution.of freedom for tα2 is n − 1
 271
271Point and Interval Estimates of the Population Mean:Mean,examples of estimation formulas or estimators.:distribution.:Efficiency.[PracticeC.

微信扫码关注公众号
获取更多考试热门资料