下载亿题库APP
联系电话:400-660-1360
下载亿题库APP
联系电话:400-660-1360

请谨慎保管和记忆你的密码,以免泄露和丢失
请谨慎保管和记忆你的密码,以免泄露和丢失
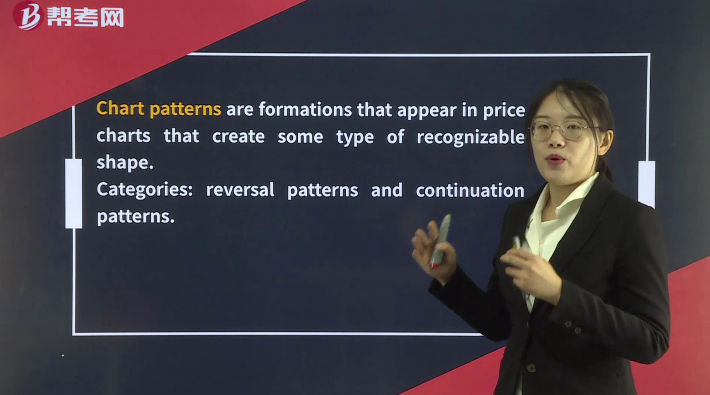
Technical Analysis Tools— Chart Patterns
Chart patterns are formations that appear in price charts that create some type of recognizable shape.
Categories: reversal patterns and continuation patterns.
 241
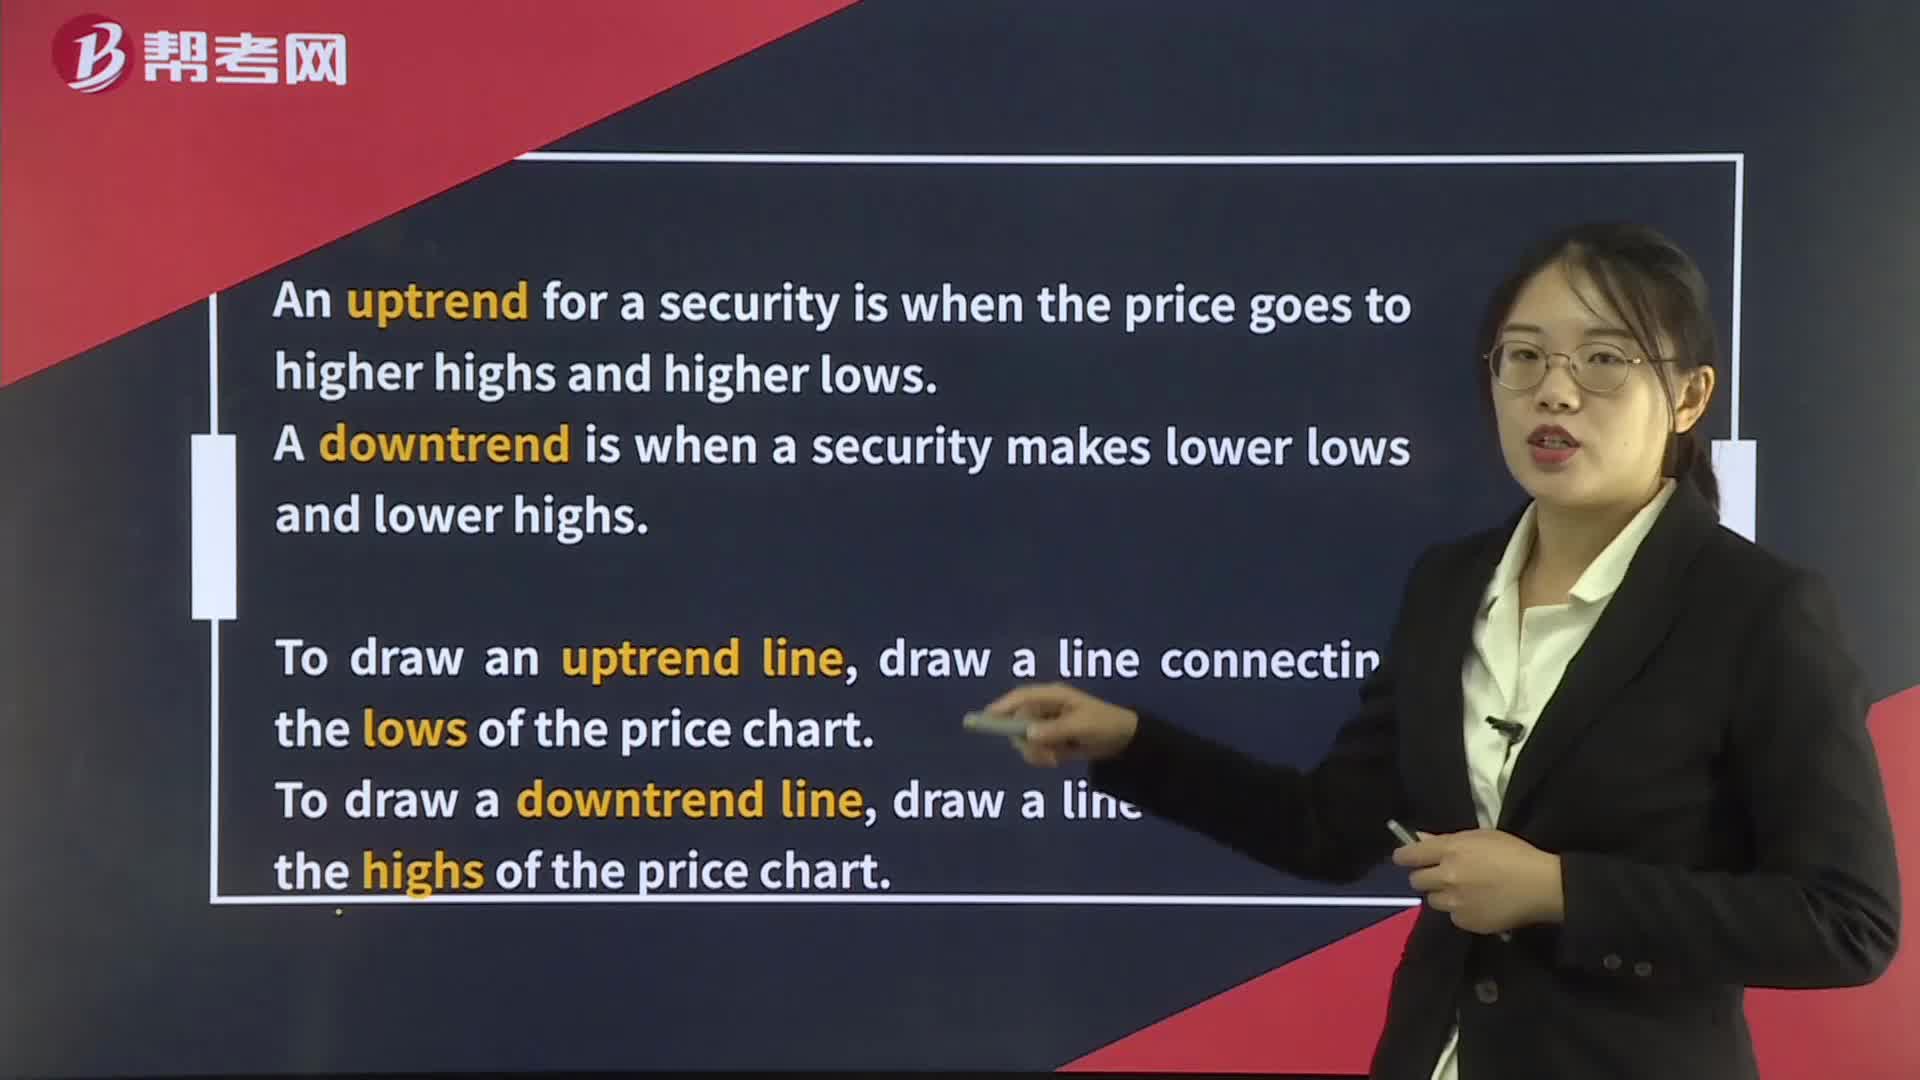
241Technical Analysis Tools— Trend:line,draw a line connecting the highs of the price chart.:price.[PracticeLtd.Change
 345
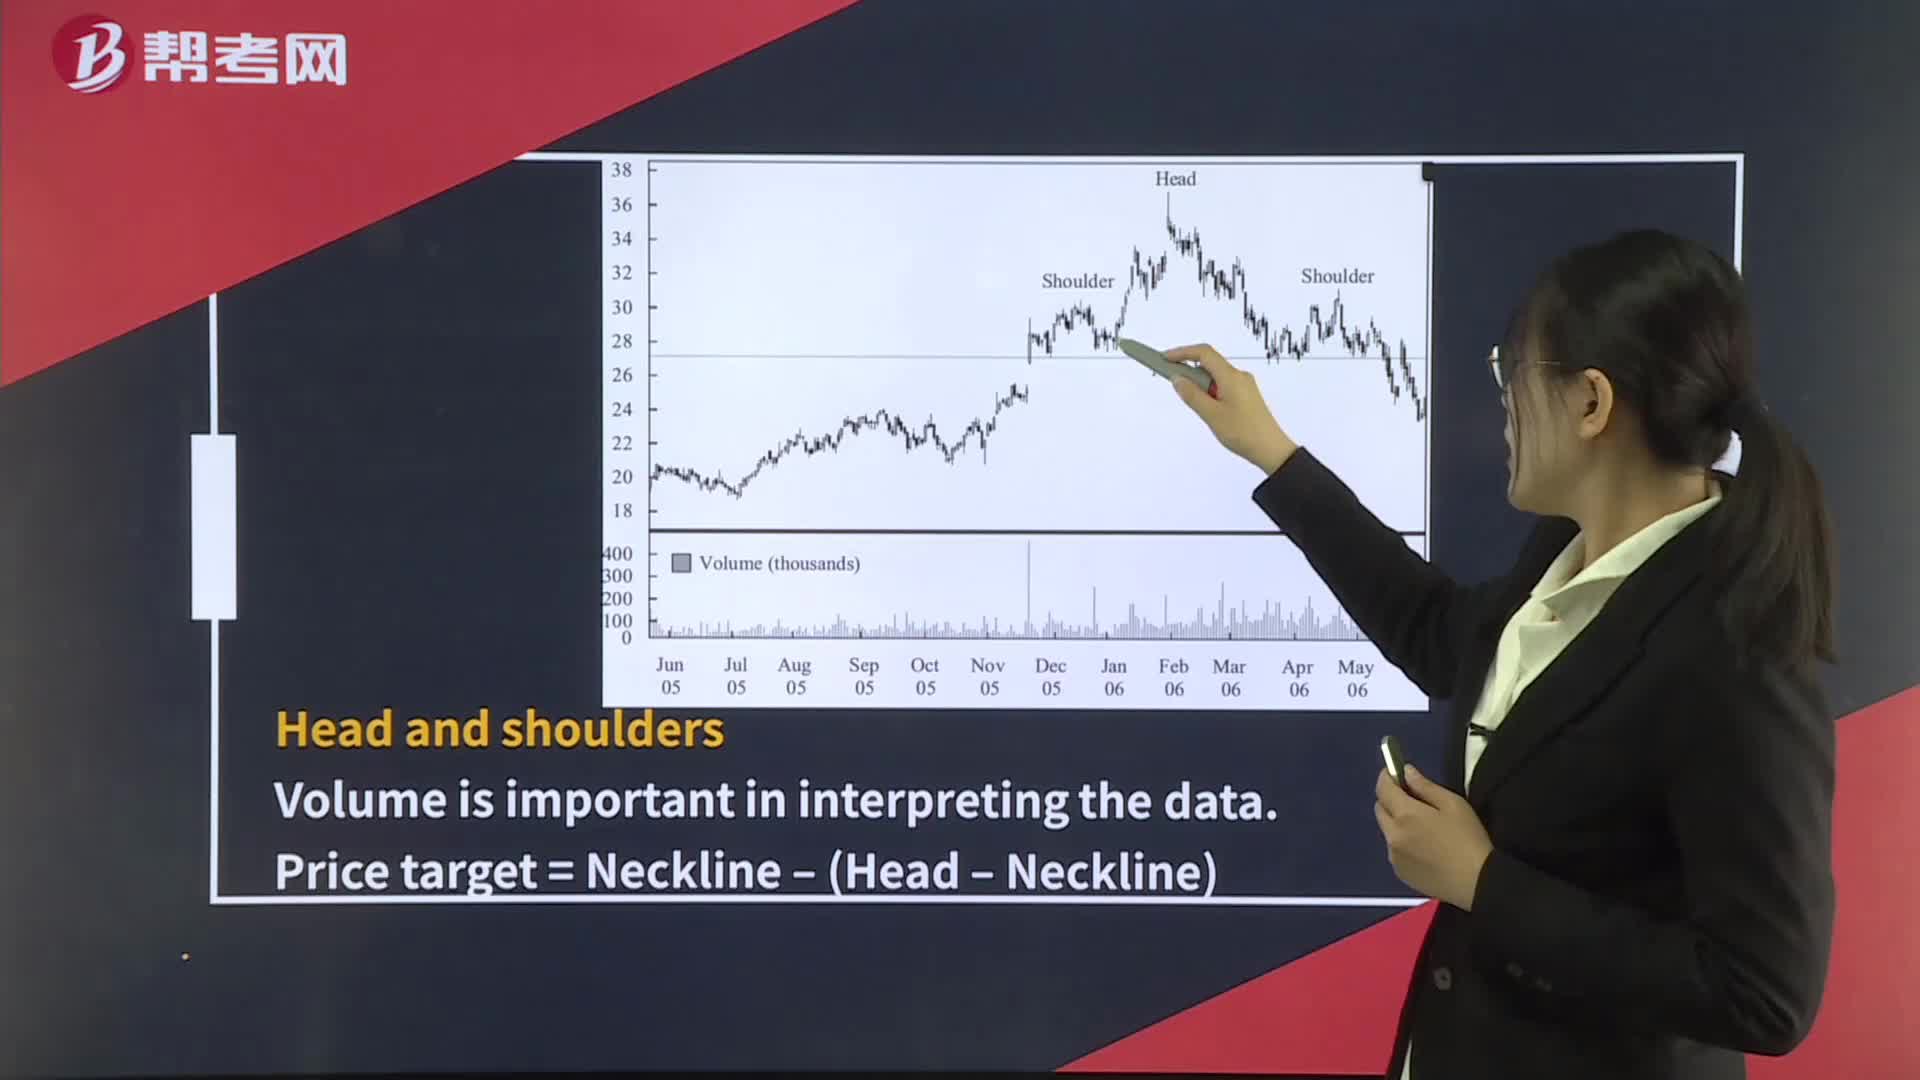
345Technical Analysis Tools— Reversal Patterns:Doublethe price is expected to appreciate above the peak between the two bottoms by at least the distance from the valley lows to the peak.
 391
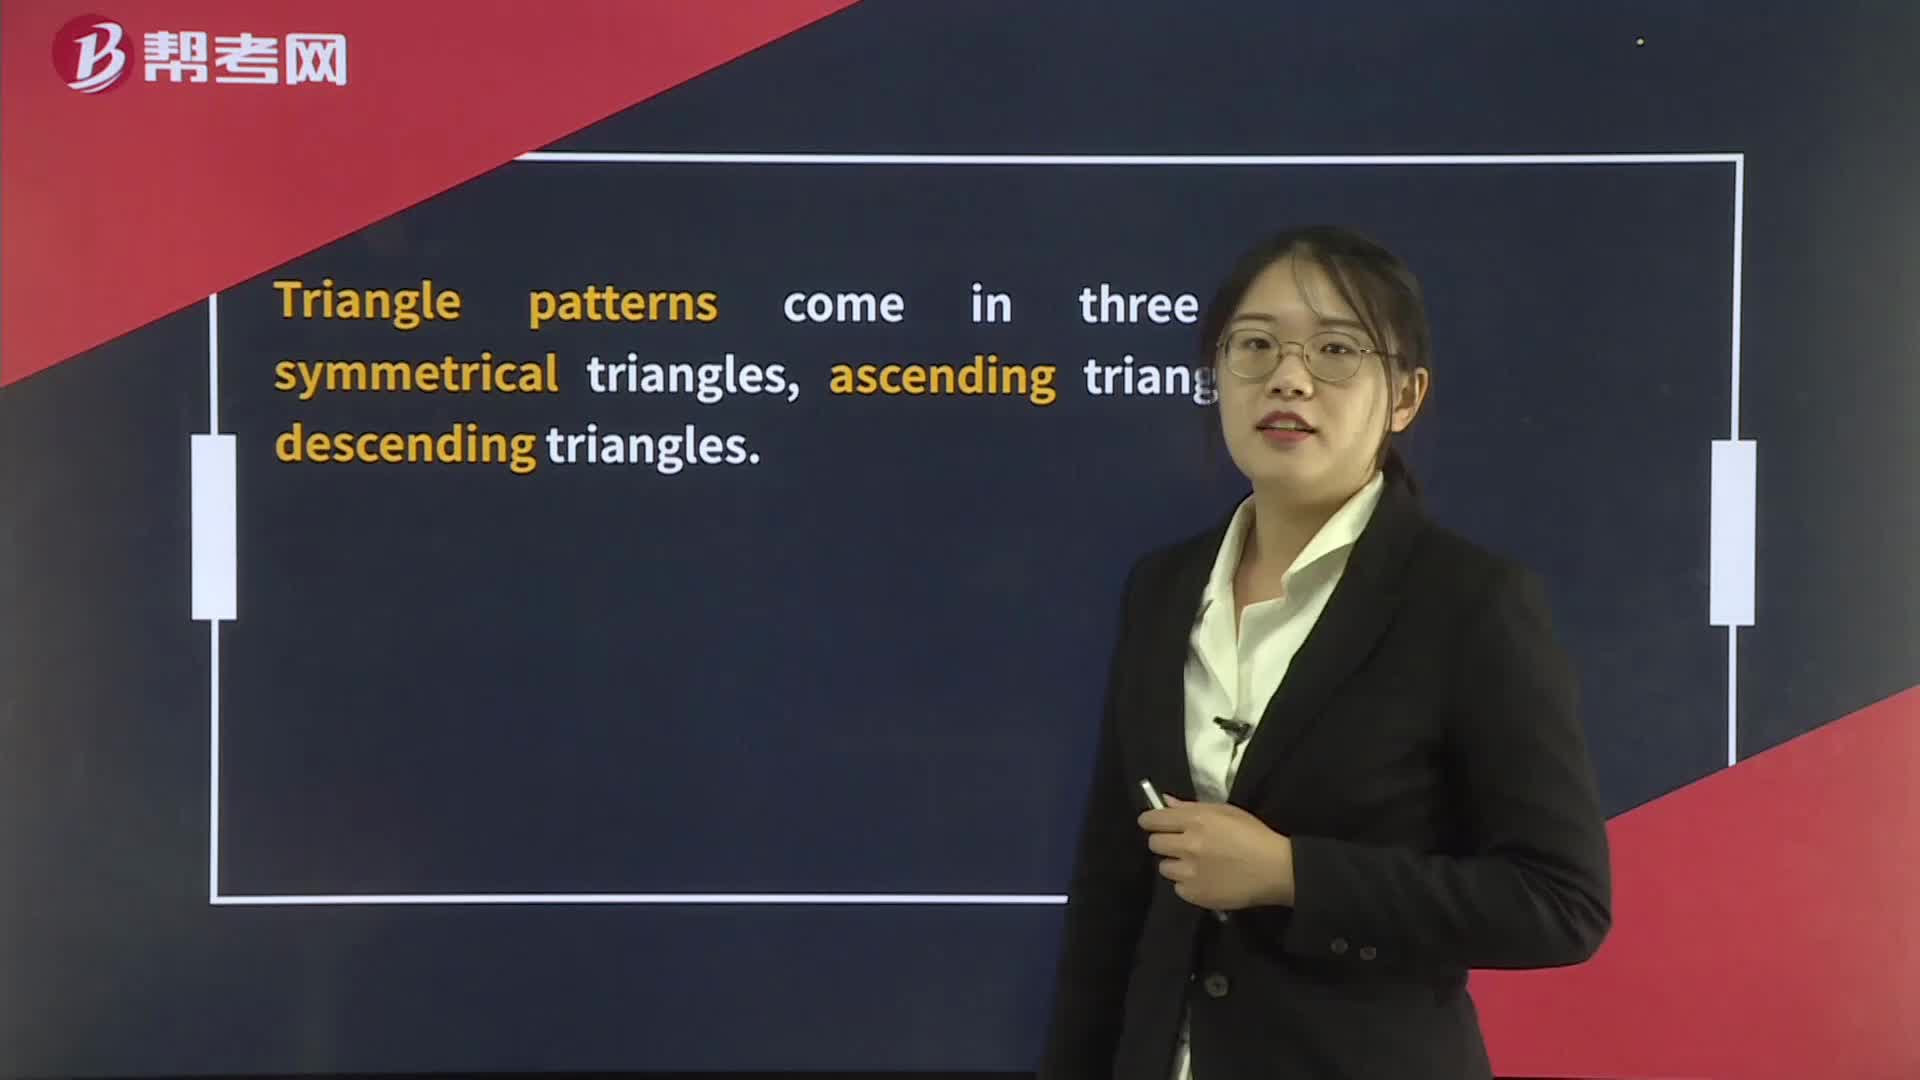
391Technical Analysis Tools— Continuation Patterns:Triangle:symmetrical triangles:FlagsFlagA pennant is a short-term formation whereas a triangle is a long-term formation.flag or pennant.

微信扫码关注公众号
获取更多考试热门资料