下载亿题库APP
联系电话:400-660-1360
下载亿题库APP
联系电话:400-660-1360

请谨慎保管和记忆你的密码,以免泄露和丢失
请谨慎保管和记忆你的密码,以免泄露和丢失
Frequency Distributions
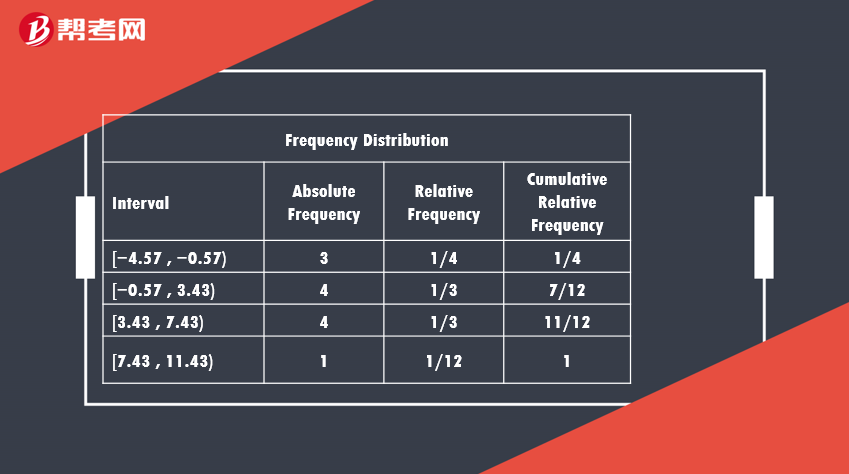
A frequency distribution is a tabular display of data summarized into a relatively small number of intervals.
An interval is a set of values within which an observation falls.
The actual number of observations in a given interval is called the absolute frequency, or simply the frequency.
The relative frequency is the absolute frequency of each interval divided by the total number of observations.
The cumulative relative frequency cumulates (adds up) the relative frequencies as we move from the first to the last interval.
Suppose we have 12 observations sorted in ascending order: −4.57, −4.04, −1.64, 0.28, 1.34, 2.35, 2.38, 4.28, 4.42, 4.68, 7.16, and 11.43. The minimum observation is −4.57 and the maximum observation is +11.43, so the range is +11.43 − (−4.57) = 16. If we set k = 4, the interval width is 16/4 = 4.
[Practice Problems] A mutual fund has the return frequency distribution shown in the following table. Which of the following statements is correct?
A. The relative frequency of the interval “–1.0 to +2.0” is 20%.
B. The relative frequency of the interval “+2.0 to +5.0” is 23%.
C. The cumulative relative frequency of the interval “+5.0 to +8.0” is 91.7%.
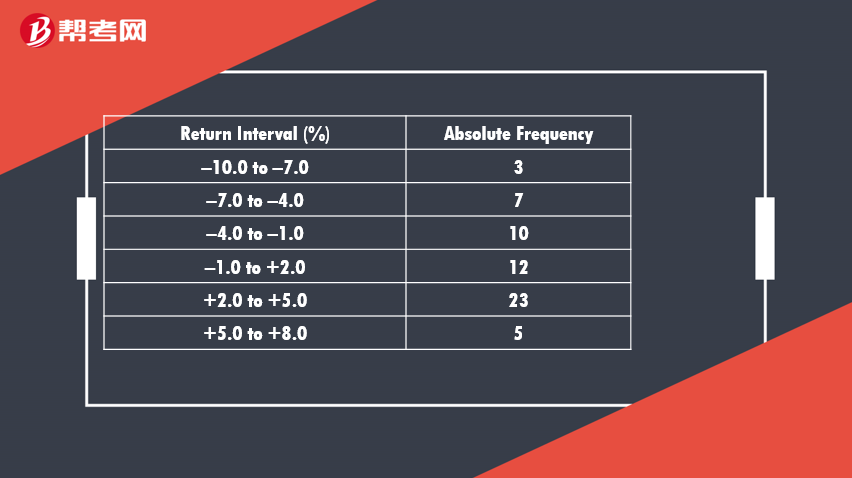
[Solutions] A
The relative frequency is calculated as: (12/60) × 100 = 20%. B is incorrect because the relative frequency of this interval is (23/60) × 100 = 38.33%. C is incorrect because the cumulative relative frequency of the last interval must equal 100%.
 367
367Frequency Distributions:frequency,2.35:[Practicecorrect–1.0 to +2.0intervalC.+5.0 to +8.0
 513
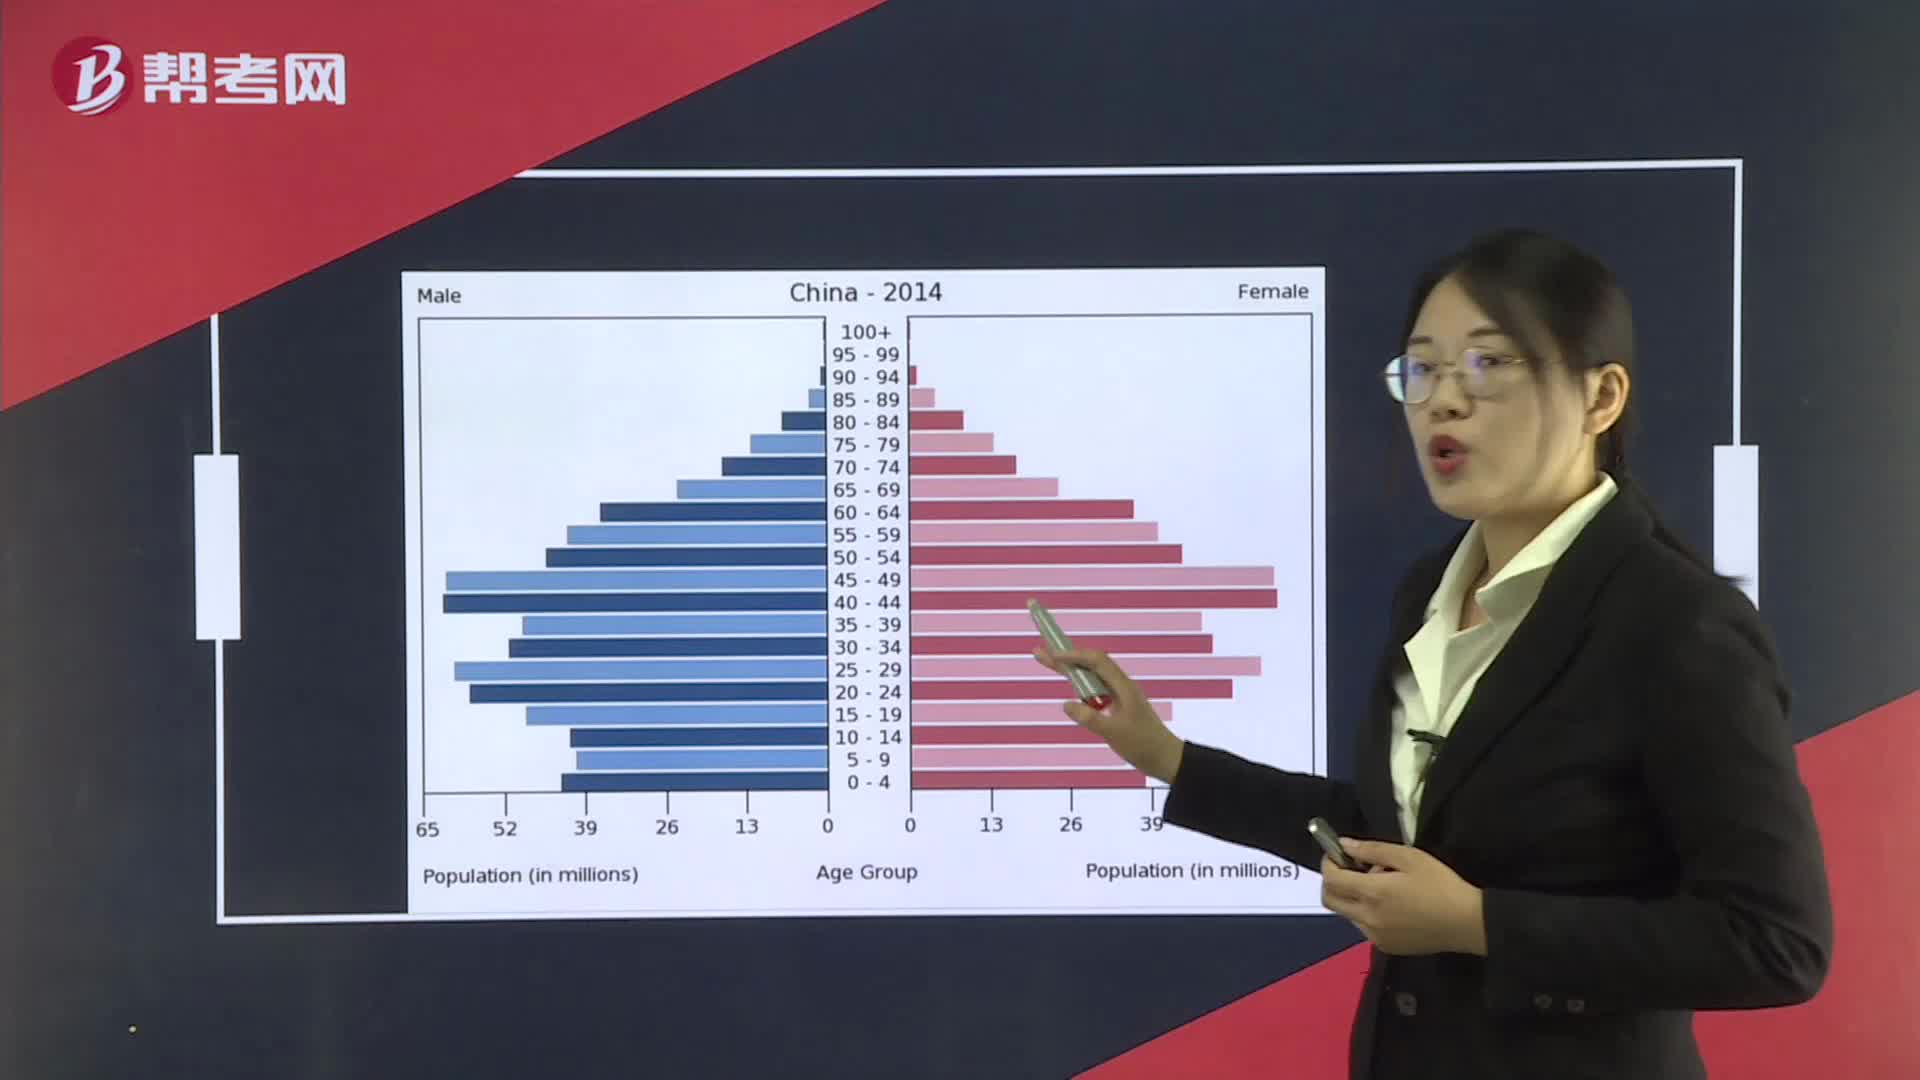
513Frequency Distributions:frequency,interval.,[Practicecorrectinterval+5.0 to +8.0x-axis and the absolute frequency for that interval on the y-axis
 265
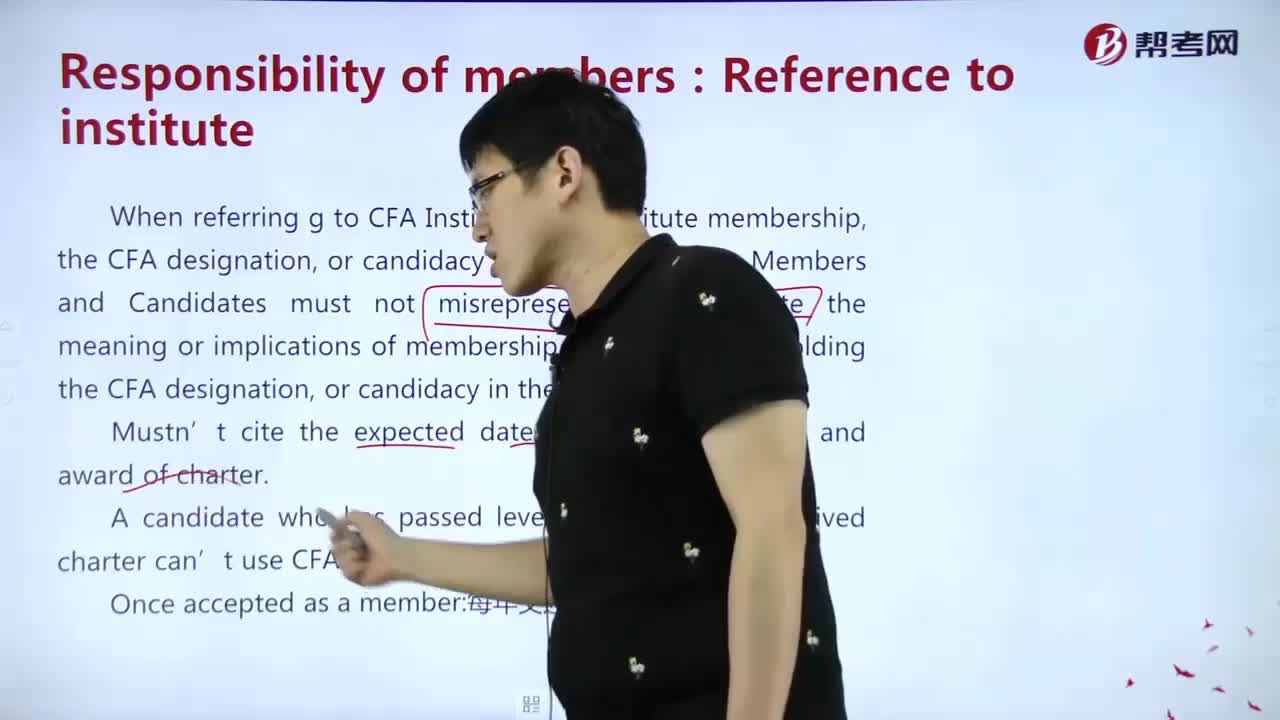
265What are the responsibilities of the members in reference to the CFA Institute?:Once accepted as a member:每年交述职报告和年费but must not over promise the competency and future investment results.Case

微信扫码关注公众号
获取更多考试热门资料