下载亿题库APP
联系电话:400-660-1360
下载亿题库APP
联系电话:400-660-1360

请谨慎保管和记忆你的密码,以免泄露和丢失
请谨慎保管和记忆你的密码,以免泄露和丢失
Hypothesis Testing
Steps in Hypothesis Testing:
1 Stating the hypotheses.
2 Identifying the appropriate test statistic and its probability distribution.
3 Specifying the significance level.
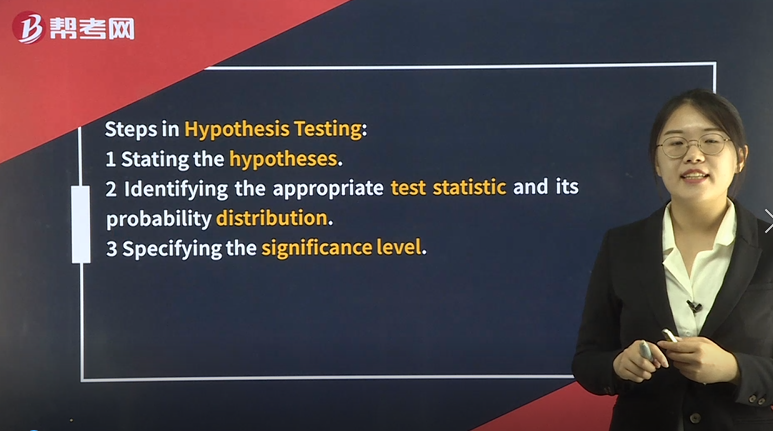
4 Stating the decision rule.
5 Collecting the data and calculating the test statistic.
6 Making the statistical decision.
7 Making the economic or investment decision.
Null Hypothesis. The hypothesis to be tested.
Alternative Hypothesis. The hypothesis accepted when the null hypothesis is rejected.
1 H0: θ = θ0 versus Ha: θ ≠ θ0 (two-sided/two-tailed)
2 H0: θ ≤ θ0 versus Ha: θ >θ0 (one-sided/one-tailed)
3 H0: θ ≥ θ0 versus Ha: θ< θ0 (one-sided/one-tailed)
Test Statistic. A test statistic is a quantity, calculated based on a sample, whose value is the basis for deciding whether or not to reject the null hypothesis.
Test statistic
=Sample statistic−Value of the population parameter under H0Standard error of the sample statistic
Four distributions for test statistics:
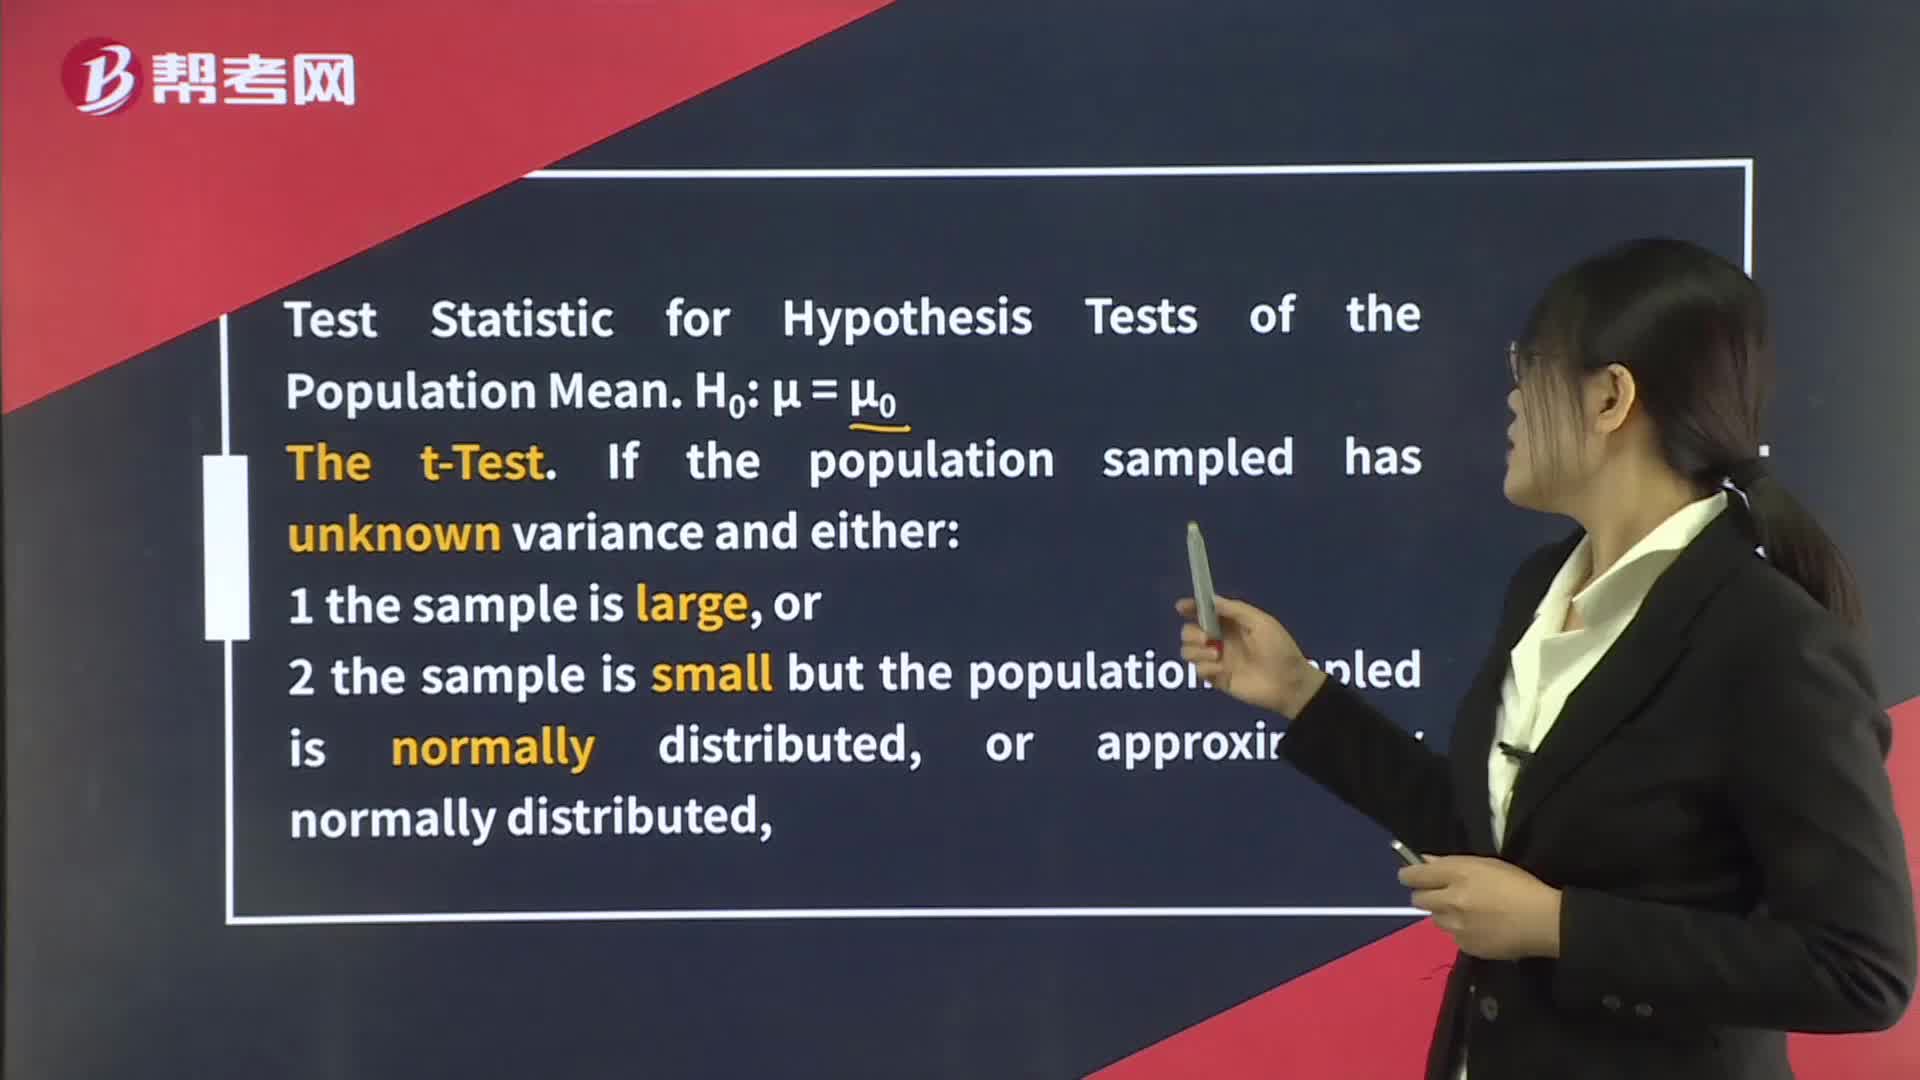
the t-distribution (for a t-test);
the standard normal or z-distribution (for a z-test);
the chi-square (χ2) distribution (for a chi-square test); and
the F-distribution (for an F-test).
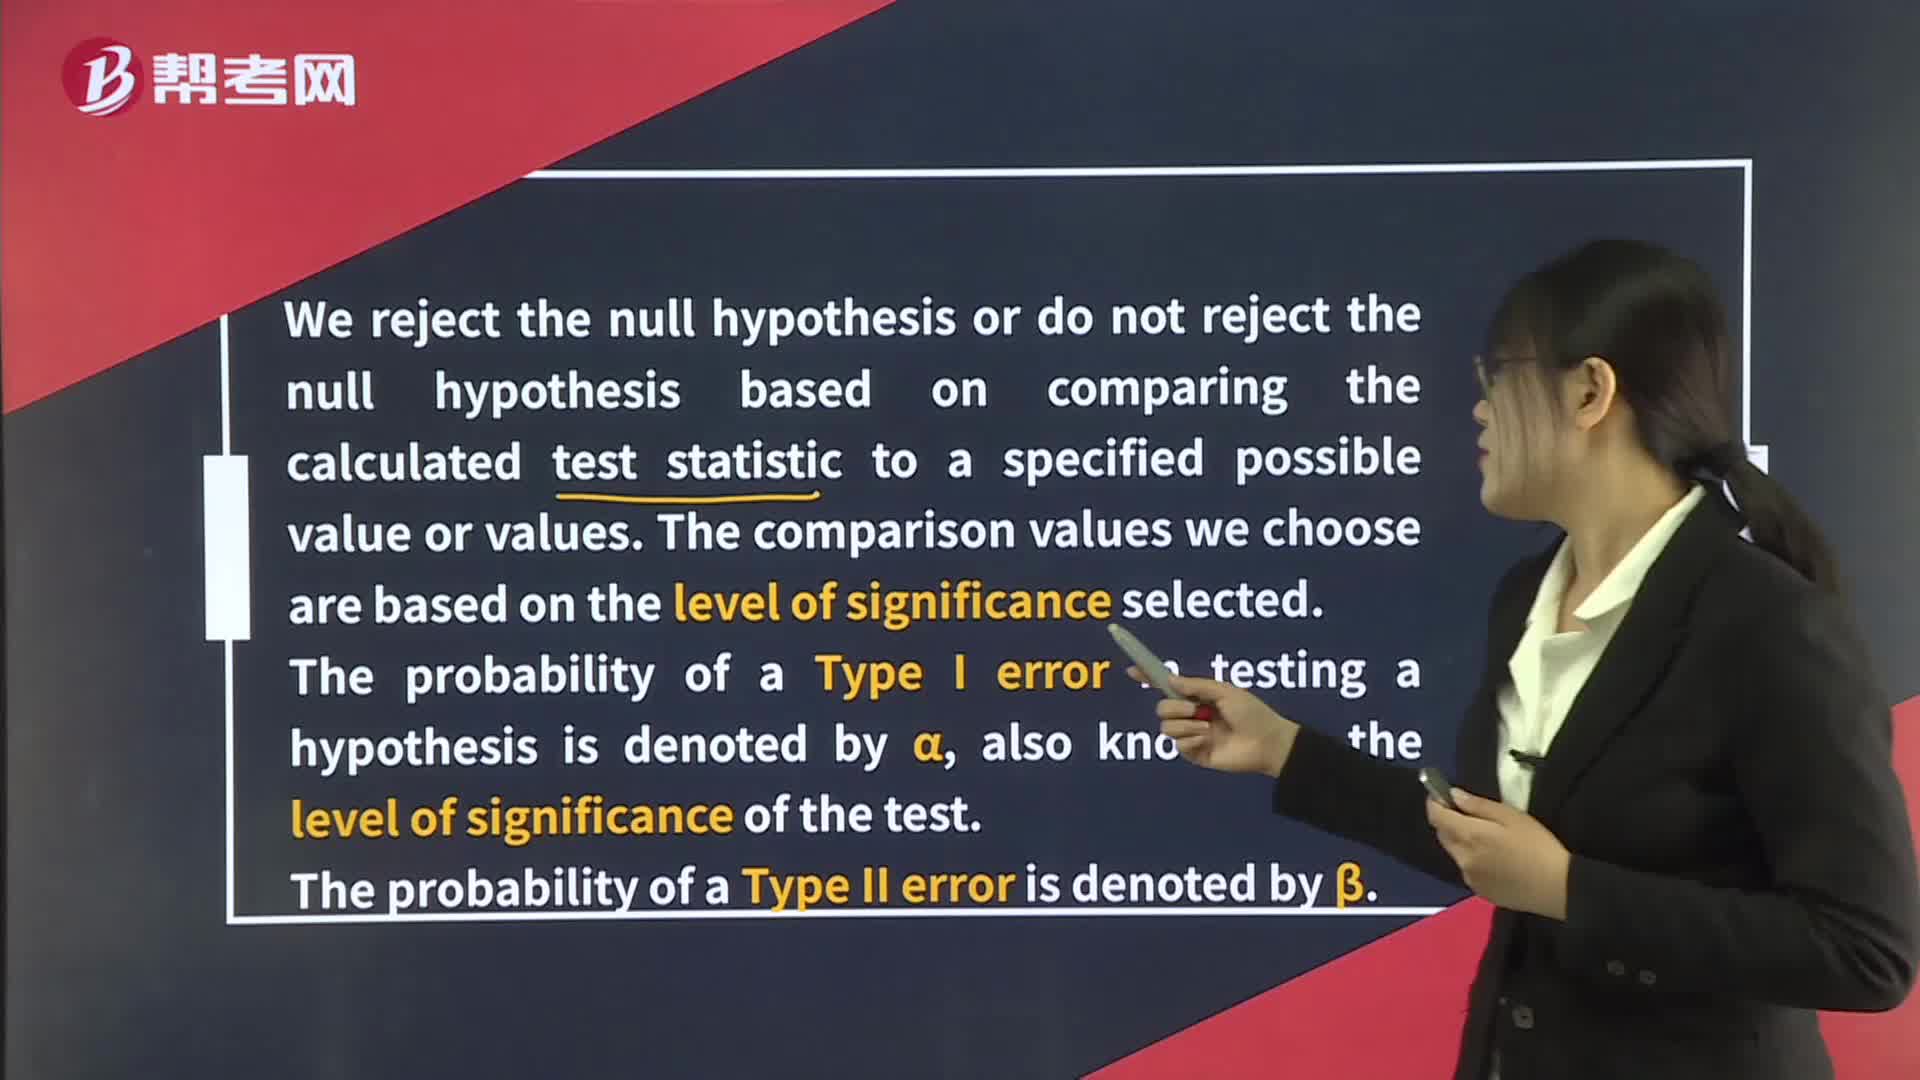
We reject the null hypothesis or do not reject the null hypothesis based on comparing the calculated test statistic to a specified possible value or values. The comparison values we choose are based on the level of significance selected.
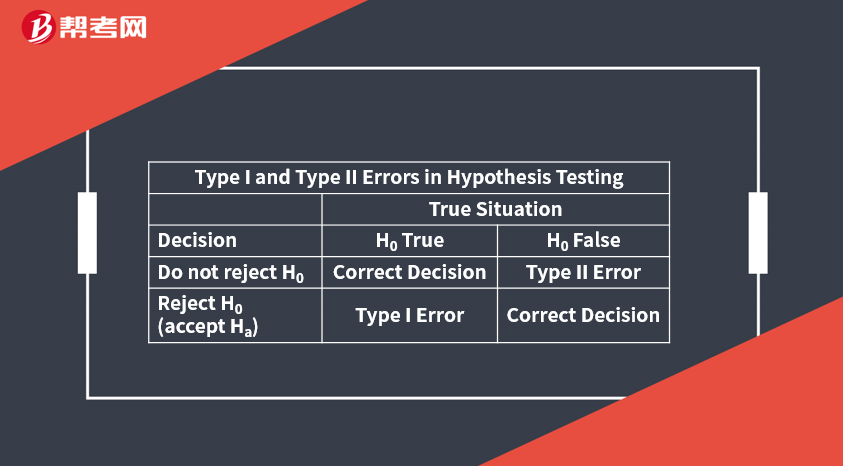
The probability of a Type I error in testing a hypothesis is denoted by α, also known as the level of significance of the test.
The probability of a Type II error is denoted byβ.
The power of a test is the probability of correctly rejecting the null. When more than one test statistic is available, we should prefer the most powerful, all else equal.
A rejection point (critical value) for a test statistic is a value with which the computed test statistic is compared to decide whether to reject or not reject the null hypothesis.
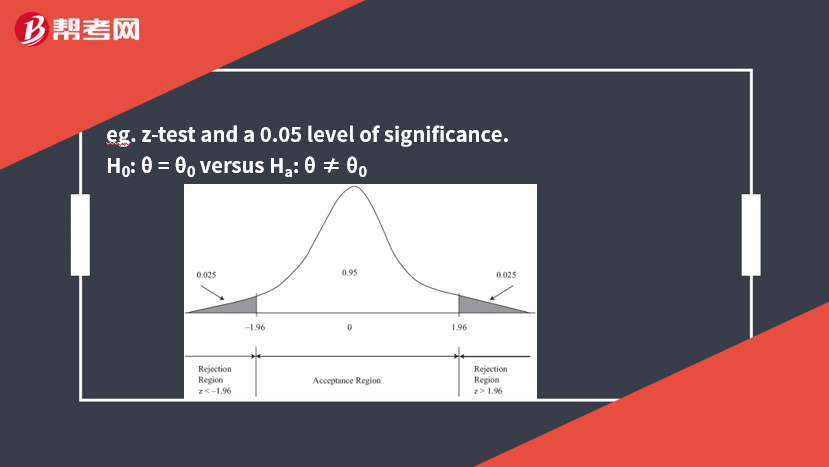
eg. z-test and a 0.05 level of significance.
H0: θ = θ0versus Ha: θ ≠ θ0
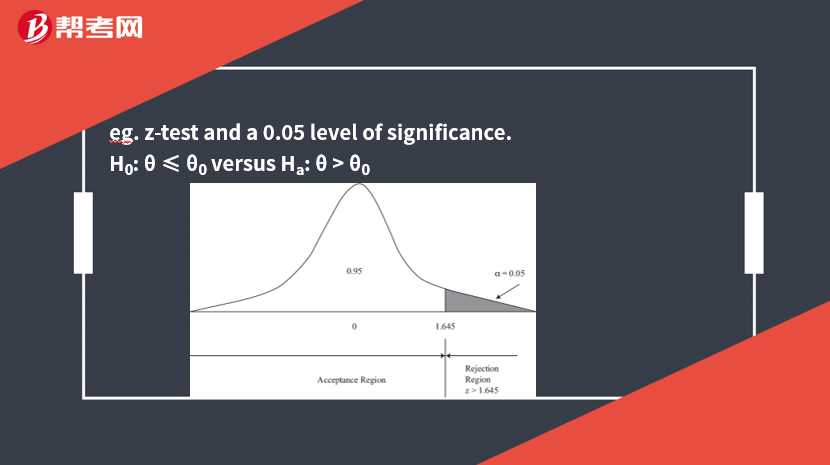
eg. z-test and a 0.05 level of significance.
H0: θ ≤ θ0versus Ha: θ >θ0
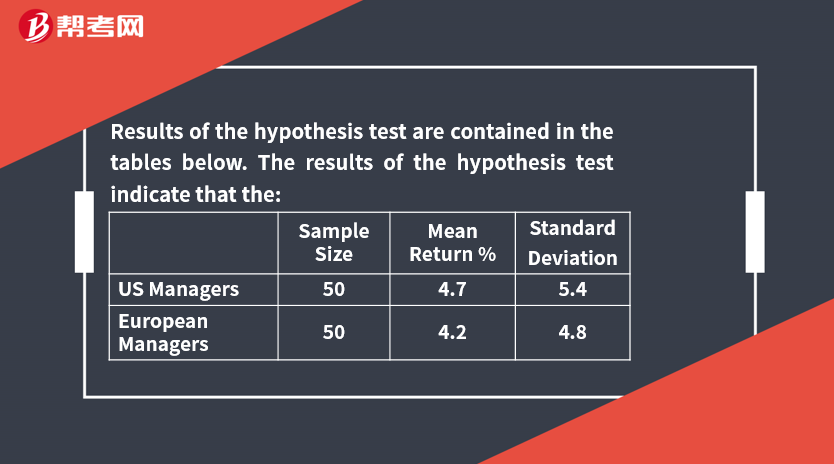
[Practice Problems] An investment consultant conducts two independent random samples of 5-year performance data for US and European absolute return hedge funds. The consultant decides to test whether the two means are statistically different from one another at a 0.05 level of significance. The two populations are assumed to be normally distributed with unknown but equal variances.
Results of the hypothesis test are contained in the tables below. The results of the hypothesis test indicate that the:
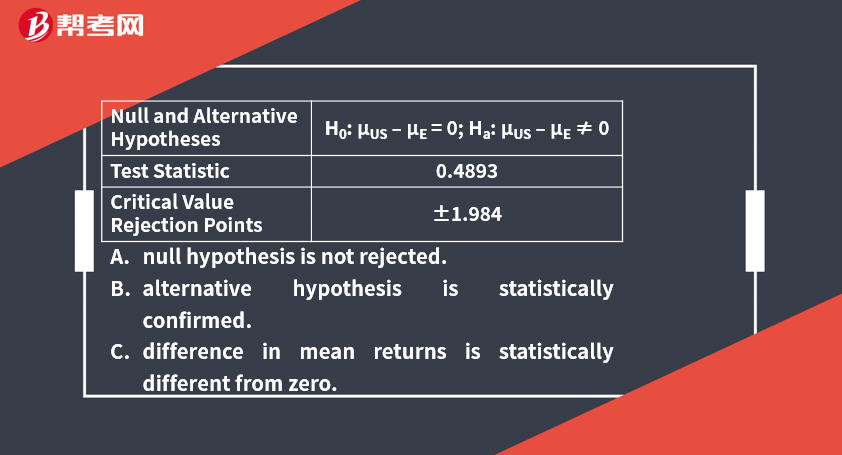
[Solutions] A
The t-statistic value of 0.4893 does not fall into the critical value rejection regions (≤ –1.984 or > 1.984). Instead it falls well within the acceptance region. Thus, H0 cannot be rejected; the result is not statistically significant at the 0.05 level.
The p-value is the smallest level of significance at which the null hypothesis can be rejected.
If the p-value is less than our specified level of significance, we reject the null hypothesis.
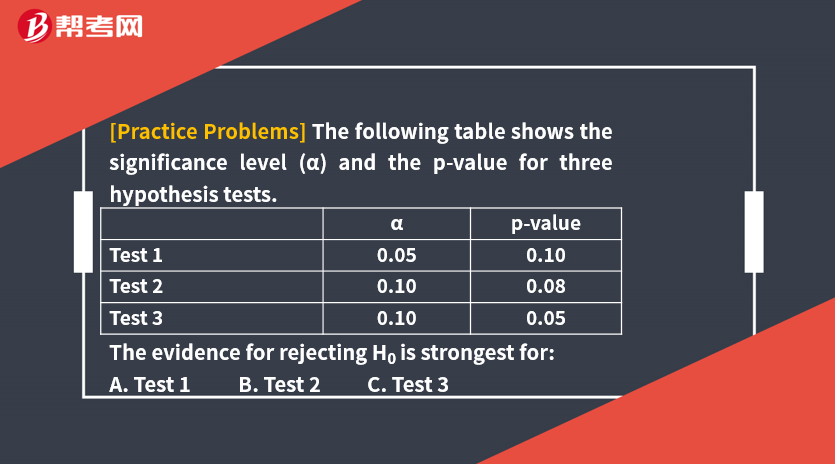
[Solutions] C
The p-value is the smallest level of significance (α) at which the null hypothesis can be rejected. If the p-value is less than α, the null can be rejected. The smaller the p-value, the stronger the evidence is against the null hypothesis and in favor of the alternative hypothesis. Thus, the evidence for rejecting the null is strongest for Test 3.
 295
295Hypothesis Tests Concerning the Mean:μrelying on the central limit theorem is
 262
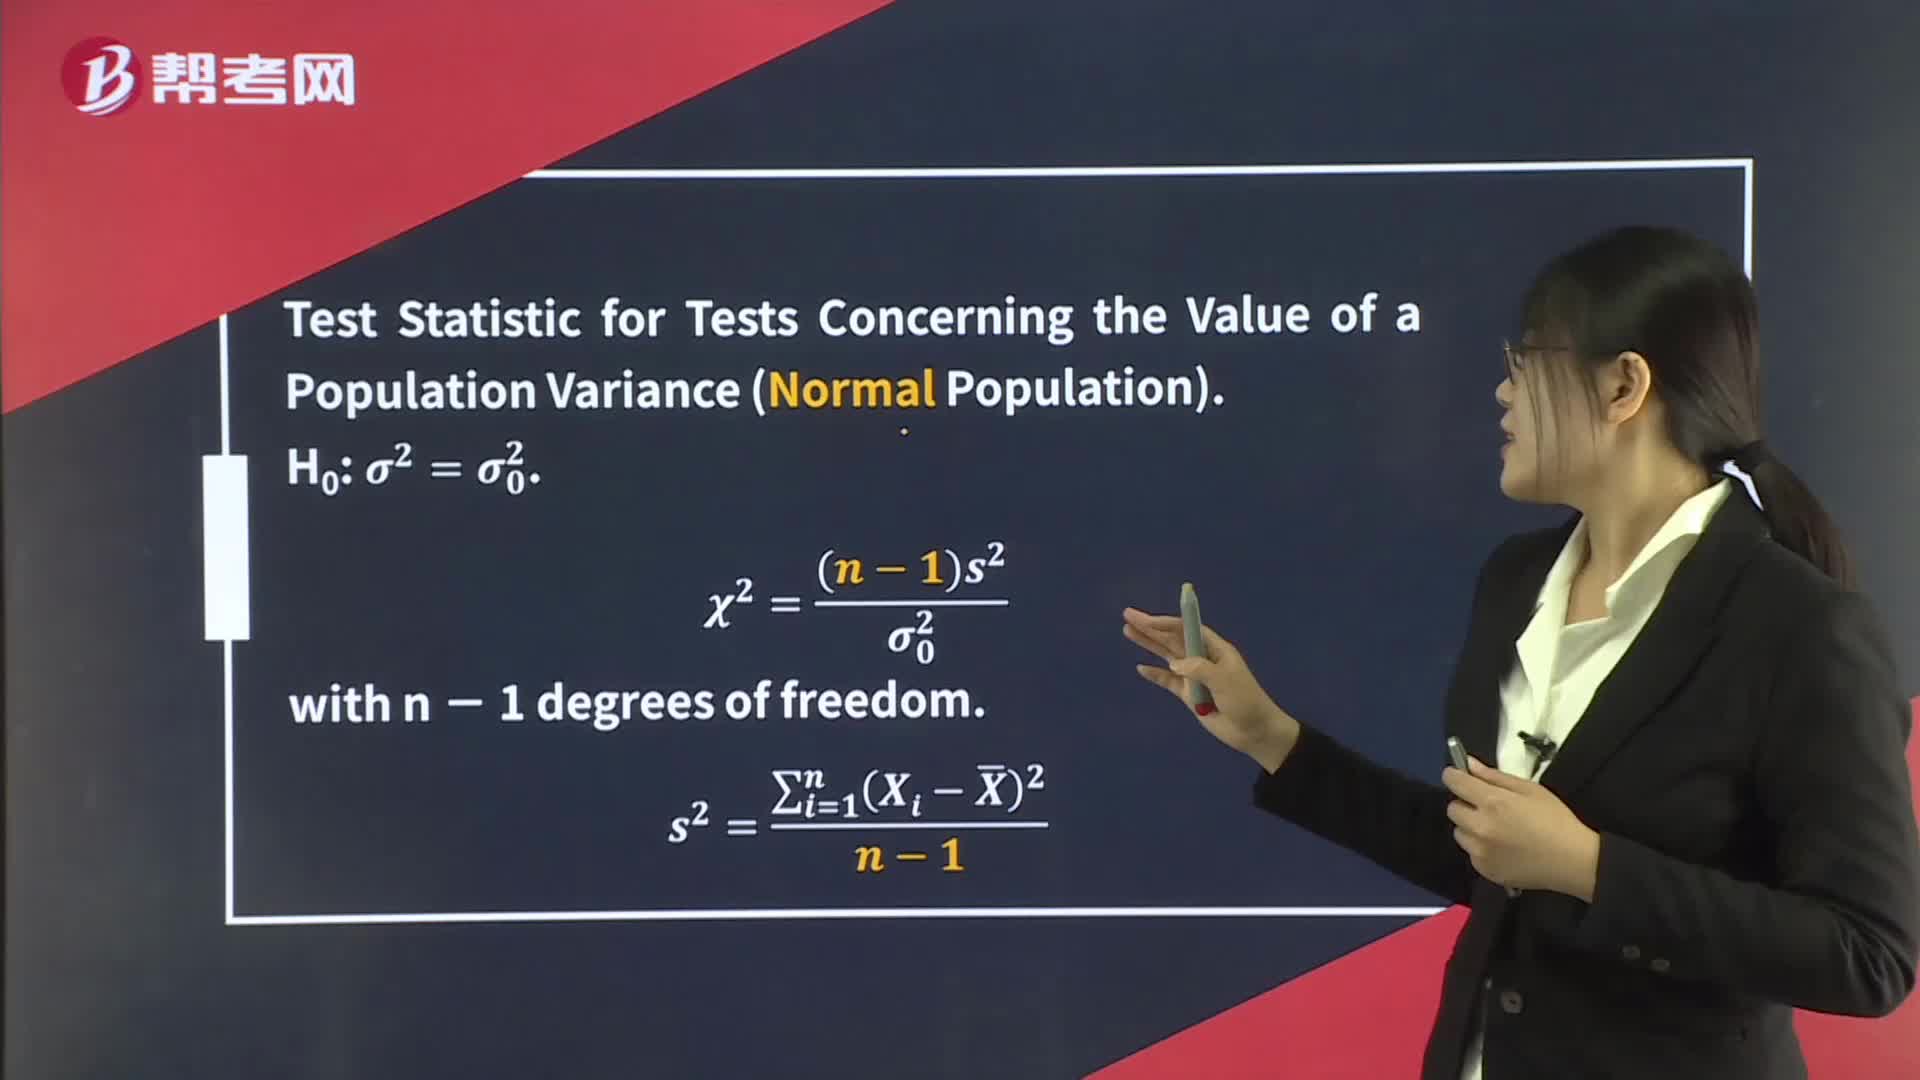
262Hypothesis Tests Concerning Variance:test statistic 𝜒2.:[PracticeB.C.the variance of a single normally distributed population.
 171
171Type I and Type II Errors in Hypothesis Testing:all else equal.

微信扫码关注公众号
获取更多考试热门资料