Fundamental Conceptsof Statistics
1. Population and Sample: Statistics is concerned with collecting, analyzing and interpreting data. A population is the entire group of individuals or objects that we want to study, while a sample is a subset of the population that we actually observe and measure.
2. Variables: A variable is a characteristic or attribute that can take on different values. There are two types of variables: categorical (also known as qualitative) and numerical (also known as quantitative).
3. Data: Data is the information that we collect from our sample or population. It can be collected using different methods such as surveys, experiments, or observational studies.
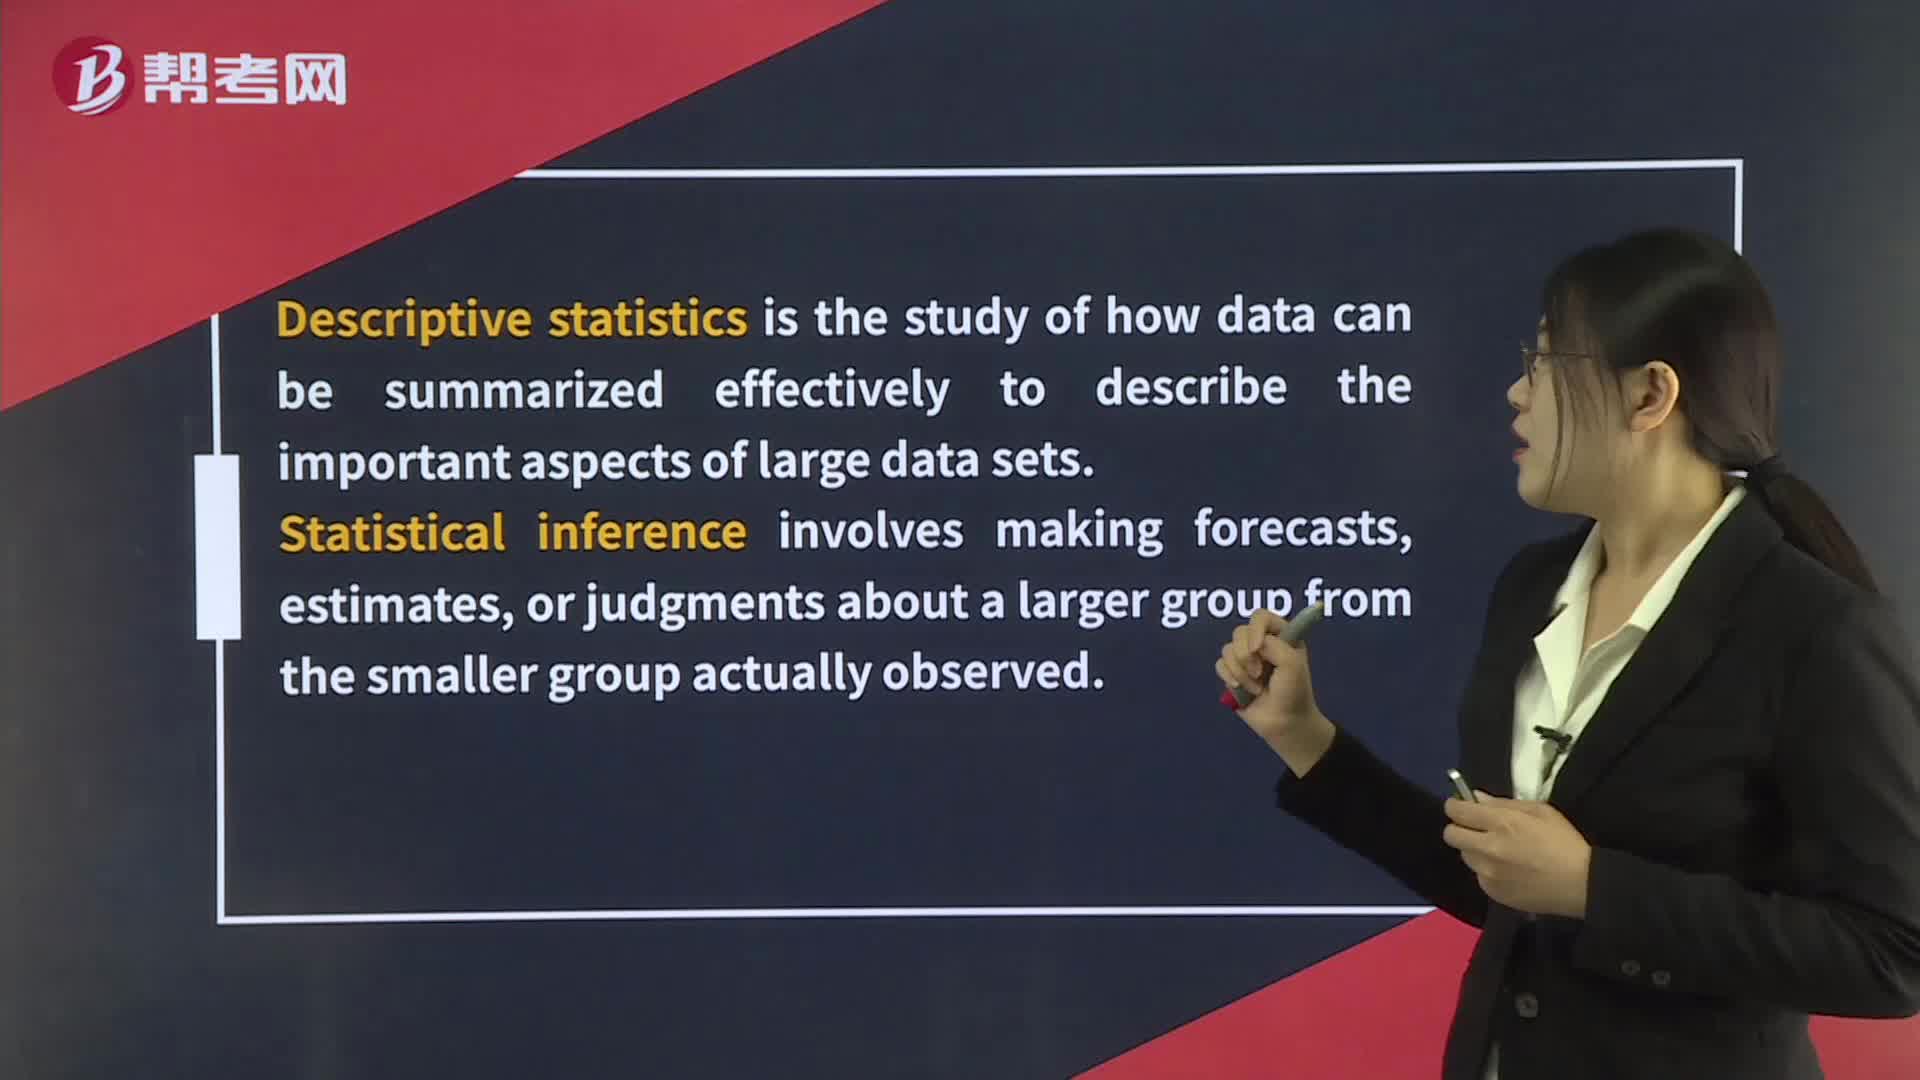
4. Descriptive Statistics: Descriptive statistics is the branch of statistics that deals with summarizing and describing the main features of the data. This includes measures of central tendency (mean, median, mode) and measures of variability (range, standard deviation).
5. Inferential Statistics: Inferential statistics is the branch of statistics that deals with making predictions or generalizations about a population based on data from a sample. This includes hypothesis testing and confidence intervals.
6. Probability: Probability is the branch of mathematics that deals with the likelihood of an event occurring. It is an important concept in statistics as it allows us to make predictions and draw conclusions about our data.
7. Sampling Methods: Sampling methods are techniques used to select a representative sample from a population. There are different types of sampling methods such as random sampling, stratified sampling, and cluster sampling.
8. Bias: Bias is a systematic error in the data collection process that leads to incorrect conclusions. It can occur due to sampling bias, measurement bias, or response bias.
9. Correlation and Regression: Correlation is a statistical technique used to measure the strength and direction of the relationship between two variables. Regression is a statistical technique used to model the relationship between a dependent variable and one or more independent variables.
10. Statistical Software: Statistical software such as SPSS, SAS, and R are used to analyze and visualize data. They provide a range of tools for data cleaning, descriptive statistics, inferential statistics, and data visualization.
 帮考网校
帮考网校